


Preliminary Study of Detecting the Occurrence of Cavitation and Evaluating its Influence by an Accelerometer Mounted on a Pipe
Yoshinori Yagi, Kansai Electric Power Company, [email protected]
Michio Murase, Institute of Nuclear Safety System, Incorporated [email protected]
Keiichi Sato, Kanazawa Institute of Technology, [email protected]
Yasuhiro Saito, Kanazawa Institute of Technology, [email protected]
Abstract
The objective of this study is to develop methods of detecting the occurrence of cavitation and evaluating its influence on pipes by means of outside measurement, in order to prevent troubles in piping systems caused by cavitation erosion and vibration. At first, we visualized cavitation behaviors downstream of an orifice and compared them with the output of an accelerometer mounted on the pipe as a preliminary study of detecting the occurrence of cavitation. As a result, near the cavitation inception region, we detected sine wave-like signals with a frequency range of 2030 kHz. We believe it might be possible to utilize this signal characteristic for detecting cavitation inception. Moreover, at the developed cavitation region we observed pulse-like signals , leading us to consider the possibility of classifying cavitation strength by the magnitude and incidence of these pulses. Secondarily, as the preliminary study of evaluating the influence of cavitation, we also compared the distribution of accelerometer outputs along the flow direction with erosion rates measured by erosion tests. The tendency broadly agreed with one another, and so we concluded that it was possible to evaluate the distribution of erosion rates with the accelerometer.
Introduction
A local rise in flow velocity in a valve or orifice where the inner pipe diameter decreases causes the fluid pressure to drop, and when the pressure falls below the saturated vapor pressure, cavitation bubbles are generated. With the decrease of flow velocity in the downstream expanded channel section, fluid pressure rises to collapse the cavitation bubbles and triggers generation of an impact pressure. This impact pressure brings about the erosion and vibration responsible for the potentional damage of a plant's piping system. If a cavitation occurrence can be detected from the outside of a piping element while the plant is in operation, the cavitation point can readily be spotted. Note, however, that cavitation does not necessarily damage the piping system at any time. While cavitation does not have any discernible influence on piping in its primary stage, it may significantly affect the piping in its transient stage, so thus the influence on piping varies substantially with the cavitation state [1]. Therefore, reliable methods for appraising the influence on piping systems are called for. The influence on piping appears as vibration and erosion. For vibration, fatigue evaluation can be conducted by applying conventional vibration tests of piping structures and in terms of acceleration measurements. For erosion, however, few reliable approaches have so far been established to determine the phenomenon from the outside of the piping during plant operation.
Studies are now being conducted to enable the detection of cavitation occurrence and evaluation of erosion by means of external measurements with the use of acoustic sensors, acoustic emission (AE) sensors, and accelerometers. Acoustic sensors can obtain favorable correlation between signal incidence and cavitation state, suggesting that the sensors can be applied for detection or similar purposes. However, since there are a number of peripheral sound sources in the actual setup, their application is considered to be difficult at certain noise levels [2]. AE sensors can achieve good correlation between cavitation state and signals [3], but the correlation between cavitation and erosion are reported to be unsatisfactory [4]. And regarding accelerometers, while good correlation between cavitation state and signals can be obtained [5], those with erosion have not been fully studied. Since accelerometers are considered to detect vibration within a relatively wide region, they deserve further study on whether they can be applied for acquiring local erosion data.
In the present work, we first conducted a series of visualization experiments on an orifice to comprehend the phenomenon in order to develop methods for detecting cavitation occurrence, and then analyzed the relationships between the phenomenon and the output of the accelerometer attached to the outside of a pipe section. We then compared the distribution of erosion rates with accelerometer output values through an erosion test as a way of defining the feasibility of evaluating cavitation influence on piping using an accelerometer. From these results we could then determine whether the relative evaluation of erosion rates was feasible.
Nomenclature
- D = diameter of the test channel
- P = downstream pressure of the orifice
- PV = saturated vapor pressure at the test water temperature
- ρ = fluid density at the test water temperature
- V = velocity of the fluid at the orifice throat
- σ = cavitation number
- β = dissolved oxygen concentration
Test Equipment
Test Loop
Figure 1 shows the loop used for the test. The loop was a closed type, consisting of a piping system comprising a reservoir, pump, and test section. The reservoir was a pressure vessel with a volume of 1.28 m3 that can be used for tests with a maximum relief valve venting pressure of 3.2 MPa. The reservoir was equipped with an internal heater to heat up the water with a precision of 1°C (150°C maximum). The flow rate was measured with an electromagnetic flow meter inserted upstream from the test section; pressures were measured with pressure gauges installed on both the upstream and downstream; and the temperature of the test fluid was measured with a thermometer mounted in the reservoir. The test fluid was pressurized and the fluid pressure was controlled with the use of a nitrogen tank attached to the reservoir. The test flow velocity was controlled by means of the pump revolution, which was regulated with an inverter. Service water was employed as the test fluid. Since the dissolved gas in the test fluid was considered to have influence on bubble generation and impact forces during bubble collapse, the concentration of dissolved oxygen was measured before and after the test to ensure that there was no significant change in the concentration. The range of dissolved oxygen concentration β is described later.

Fig. 1 Test loop
Test Section
The test section is detailed in Figure 2. Both ends of the section were made of flanged stainless steel with the upstream-end flange constituting an orifice. The inside diameter of the piping was D = 49.5 mm and that of the orifice throat was 0.5×D. The channel section between the flanges was made of acrylic resin so that the fluid behavior could be observed visually. The channel section was provided with an array of through holes at regular intervals to mount test specimens for the erosion test. Each mounting through hole was threaded to set a plug. Figure 3 shows the structure of the test specimen. The erosion surface diameter at the tip of the test specimen was 5 mm. The accelerometer was mounted on the outside of the channel wall.

Fig. 2 Test section (Unit: mm)
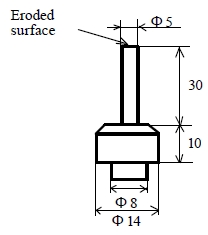
Fig. 3 Erosion test specimen (Unit: mm)
Test Methods
Cavitation Number
The critical parameter in determining cavitation test conditions is the cavitation number. Its variation causes the magnitude of impact on the piping to vary accordingly. The cavitation number σ is defined as follows:

where P represents the downstream pressure of the orifice, PV denotes the saturated vapor pressure at the test water temperature, ρ indicates the fluid density at the test water temperature, and V is the velocity of the fluid at the orifice throat, whose value is calculated by dividing the flow rate measured with an electromagnetic flow meter by the channel crosssectional area.
In the present work, we evaluated the relative variation of cavitation impact due to the variation measured by examining the variation in accelerometer output voltage, and used the results to determine the cavitation number of the test condition. When varying the cavitation number, we fixed the flow velocity and changed the downstream pressure only.
Measurement of the Impulsive Acceleration with an Accelerometer
When measuring the acceleration of impacts sustained by a wall surface at cavitation bubble collapse (referred to as the impulsive acceleration) with the use of an accelerometer, its dominant frequency is said to fall within an order of multiple 10 kHz [6]. Likewise, when using the sensor for predicting the erosion, signals with frequencies over 10 kHz are understood to be critical [2]. In the present work, we thus employed a piezoelectric type accelerometer that can measure high frequencies (manufactured by TEAC, 703FB, 0.3 kHz 45kHz ±3 dB). Figure 4 schematically shows the measuring system using an accelerometer. The accelerometer was attached to the test section by using thin double-sided tape and then secured with a plastic band (Lock Tie). The signal from this accelerometer was input to an amplifier for subsequent display on a digital oscilloscope, and then stored in a personal computer. The stored data were then processed on the computer after completion of the test.

Fig. 4 Acceleration measuring system with an accelerometer
Measurement of Erosion Rate
By using a precision balance (minimum reading 0.01 mg), we measured the mass of each test specimen before and after the test, calculated the erosion loss per unit time from the mass change and test duration, and determined the erosion rate.
In an erosion test, the erosion surface is normally mirrorfinished and subjected to cavitation. When the erosion rate reaches its maximum region and levels off, its value is used for the evaluation. In the case of a cavitation-tunnel test, since the erosion rate is relatively small, a considerable period of time is required to arrive at the maximum region. In contrast, using such a soft material as aluminum for the preparation of test specimen can reduce the test duration, though considerably large protrusions grow on the surface and may affect the flow. Thus, in this study, we have employed pure copper (C1100BD-H), which is remarkably less affected by the presence of protrusions. The time required for pure copper to reach its maximum erosion level is approximately three times longer than for aluminum.
To reduce the test duration, we subjected the mirror-finished erosion surface of each test specimen to a cavitation environment in magnetostrictive vibratory cavitation erosion test device so that the erosion surface was pretreated to the maximum erosion level before conducting the cavitation-tunnel test. Figure 5 indicates the change in erosion rate with time of test specimen of the same material in the magnetostrictive vibratory test conducted prior to the main experiment. As a result, the erosion rate reached the maximum region in 20 minutes after starting the test and the value leveled off thereafter. Based on these results, we set the required pretreatment time to 25 minutes.
Since the flow state could be affected if the erosion surface of each test specimen either protrudes or recedes against the channel wall surface, we mounted each test specimen by finely adjusting the test specimen shape to the corresponding mounting hole shape so that all the erosion surfaces were positioned flush to one another against the channel.
We evaluated the distribution of erosion rates in the flow direction from the erosion rate of each test specimen mounting position, and compared this with the distribution of accelerometer output values by changing each sensor's attached location.

Fig. 5 Copper test piece erosion rate variation with time in a magnetostrictive vibratory test
Mounting Positions of the Test Specimen
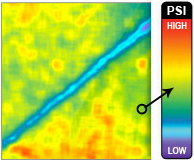
Prior to determining the distribution of erosion rates in the flow direction, we used a pressure-measurement sheet (PRESCALE, for medium pressures, mono-sheet type, pressure range 10 MPa to 50 MPa, manufactured by Fuji Film) to plot the distribution of impact strength so that the test specimen could be mounted in the maximum erosion rate regions. The pressure-measurement sheet is white before pressure application and turns red as soon as pressure is applied due to microcapsules in the colordevelopment layer. Subjecting the pressure-measurement sheet to cavitation generates a number of minute red spots that looked as if it were pricked with needles. Regions with higher densities of red spots can be judged as a region where a higher incidence of cavitation impacts occurs. However, since the colordeveloping layer is dissolved with water, we mounted it on the test section in such a manner that the color-developing layer side was on the inner wall of the test channel section with a thin, double-sided tape, and then the edges of the pressure-bearing side were bonded with pieces of a strong self-adhering tape to prevent water infiltration. Moreover, because a larger area of pressure-measurement sheet causes the sheet to ripple because the inner pressure of the channel turns negative during testing, we cut the sheet in a strip form (length: 210 mm, width: 15 mm) and attached them in multiple numbers. Based on the results, we determined the mounting positions for the test specimens.
Test Results and Discussion
Relationships between Cavitation Number and Impulsive Acceleration
To evaluate the variations of impulsive acceleration with the variations of cavitation number, we mounted an accelerometer at an observation spot based on a conceivable cavitation transition region that was downstream, 100 mm away from the outlet of the orifice where cavitation bubbles reached. Then, maintaining a constant flow velocity (15.0 m/s to 15.4 m/s) and using the cavitation number as a parameter, we measured the imp ulsive acceleration of the piping wall. The dissolved oxygen concentration was b = 3.77 g/m3 to 6.55 g/m3. The accelerometer output variation in these conditions is indicated in Figure 6. On the vertical axis, the value obtained by dividing the mean of the accelerometer output voltage RMS values (512-piece data) by the mean of the output voltage RMS values when no cavitation is generated (σ = 3.0, 2.8), (which is called the accelerometer output ratio), was plotted. In the orifice system treated in the present work, the accelerometer output began to increase at approximately σ = 2.6. In this state, cavitation noise began to be audible, however, the bubbles were too fine and faint to be visually observed. The acceleration increased to the vicinity of σ = 1.8, and then the output began to decrease, while in the range of σ = 1.6 to 1.4, the value dropped. Judging from the fact that the bubbles were visible around σ = 1.6, we considered the range as far as σ = 1.4 to be the cavitation inception region. Further decreasing s allowed the output to increase and reach its peak value in the vicinity of s = 0.65. When the value was σ < 0.6, super cavitation took place and the output of the accelerometer dropped. These results indicate that conducting an erosion test in peak output conditions accelerates erosion, although a slight deviation of the test pressure may significantly change the cavitation state, and that in the region of cavitation number lower than the peak, flow condition tends to become unstable. Accordingly, we set the test condition to a prepeak value of σ = 0.7. We set the flow velocity to around 15 m/s with due consideration of the maximum permissible acceleration of the accelerometer.
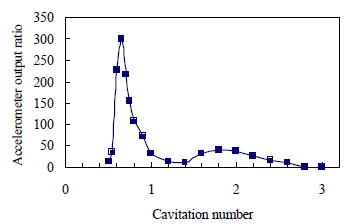
Fig. 6 Relative variation of accelerometer ratio with the variation of cavitation number
Distribution of Impact Strength
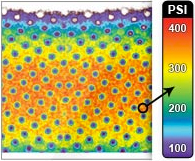
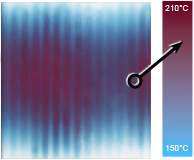
Figure 7 gives the measured results of the flow aspect when flow velocity was V = 15.3 m/s, cavitation number s = 0.7, water temperature 21°C, downstream pressure P = 0.08 MPa, for the dissolved oxygen concentration b = 4.11 g/m3 to 5.61g/m3, and the distribution of impact strength determined with pressure-measurement sheet for the value of dissolved oxygen concentration b = 6.89 g/m3 to 8.11 g/m3. The pressure-measurement sheet was exposed for 30 minutes. In the test, the sheet was vulnerable to water, so as the test started immediately after charging the test system with water, the dissolved oxygen concentration was at a high level.
In the downstream region of 50 mm to 100 mm, large cloud cavitation were observed and in the area surrounded by the dashed line, flocks of bubble close to the wall surface were present. In the orifice downstream range of 55 mm to 80 mm on the pressure-measurement sheet, a dense color-development region was generated, where the bubble flocks were conceivably affecting the impact strength and color-development region. In denser color-development regions, we mounted the test specimens at shorter intervals, while longer intervals were taken for thinner color-development regions.

Fig.7 Photograph of flow condition and impact strength distribution on pressure-measurement sheet σ = 0.7, V = 15.3m/s, Water temperature 21°C, P = 0.08MPa)
Characteristics of Accelerometer Output Signals
Figure 8 indicates the accelerometer output waveforms and flow conditions when maintaining a constant flow velocity (15.0 m/s to 15.4 m/s) and varying the cavitation number σ = 2.8, 1.8, 1.4, 0.9 and 0.7. The data recording time was 0.2 seconds and the accelerometer mounting position was set 100 mm downstream of the orifice outlet. The dissolved oxygen concentrations were b = 4.15 g/m3 to 7.26 g/m3 and b = 4.11 g/m3 to 7.42 g/m3 at output measurement and when photographing the flow condition, respectively. While the output was minimal when no cavitation was present with σ = 2.8, a waveform indicating a number of output variations in succession was obtained in the inception stage with σ = 1.8 and 1.4. In the cavitation-developing stage with σ = 0.9 and the fairly developed state with σ = 0.7, pulse-like signals were detected and as the test progressed, the incidence of signals increased as well. Thus, in the cavitation-developed stages with σ = 0.9 and 0.7, detecting a cavitation is feasible in the presence of pulse-like signals and classifying the extent of cavitation intensity is considered to be practicable in accordance with the magnitude as well as incidence of these signals . However, because of the low output of waveforms in the inception stage, no characteristic point could be found in Figure 8. Accordingly, we analyzed the output signals in further detail. Figure 9 exhibits the detailed displays of part of each waveform given in Figure 8 and the results of their frequency analyses. In the inception stage with σ = 1.8 and σ = 1.4, waveforms close to a sine wave were detected. A frequency analysis disclosed that these waveforms were in the high-frequency region of 20 kHz to30 kHz, and that the signals were characteristic of cavitations.

Fig. 8 Flow condition and output waveform at each cavitation number

Fig. 9 Detailed output signals and frequency analyses
Based on the fact that these waveforms were not detected in the cavitation-free stage with σ = 2.8 and were increasingly detected with the occurrence of cavitation, the probability of noise generation was considered to be minimal. A typical waveform became clearer at σ = 1.4 and appeared to be bobbinshaped. The bobbin-like waveform tended to be deformed as the cavitation progressed. As long as this high-frequency waveform that was close to a sine wave is characteris tic of the inception stage and its vicinity, the inception stage can be relatively easily identified. Regarding this point, verification is thus required whether or not similar waveforms can be detected in other forms and in metal pipe sections as well.
Distribution of Erosion Rates
Figure 10 illustrates the flow-direction erosion rate distribution that was obtained by first determining the test specimen-mounting positions based on the impact force distributions recorded on pieces of pressuremeasurement sheet and then by measuring the values in the erosion test. The flow velocity was V = 15.3 m/s, cavitation number σ = 0.7, and dissolved oxygen concentration b = 4.69 g/m3 to 6.56 g/m3. The mean values of erosion rates obtained through five erosion tests at each position are presented. The peak values of erosion rate occurred in the range from 60 mm to 75 mm.

Fig. 10 Erosion rate distribution (V = 15.3 m/s, σ = 0.7)
Distribution of Accelerometer Output Values
Using the same fluid conditions as used in the erosion test, we determined the distribution of accelerometer output values in the flow direction and compared their distribution with that of erosion rates. The dissolved oxygen concentration was β = 4.18 g/m3 to 6.55 g/m3. For data collection, we set a trigger level and collected output values above that trigger only.

Fig. 11 Accelerometer output distribution (V=15.3 m/s, σ = 0.7)
Figure 11 gives the measured results of acceleration output distribution by mounting the accelerometer downstream at positions 10 mm, 50 mm, 100 mm, 140 mm and 190 mm away from the orifice outlet. Even when changing the trigger level, the output distribution curve forms remained identical.
We then conducted the measurements by narrowing the intervals of mounting the accelerometers. Since peak values were predicted to fall within the range of 50 mm to 140 mm based on the results given in Figure 11, we measured these values by setting the mounting positions to 50 mm, 60 mm, 75 mm, 100 mm and 140 mm. The results obtained are given in Figure 12. As shown in Figure 11, since the output distribution forms on the basis of the trigger level are the same, the results with a trigger level of 500 mV only were shown. Comparing the results in Figure 12 with those of the erosion rate distribution in Figure 10 indicates that the measured value at 60 mm was small and that the peak position shifted slightly in the downstream direction. However, these tendencies roughly coincide, so it is thus considered that the distribution of erosion rates can be evaluated from the distribution of accelerometer outputs. That is, local data from inside the piping can be obtained to a certain extent through measurements with accelerometers.
Regarding the fact that peak value positions in the accelerometer output distribution deviate slightly from those in the erosion distribution, we intend to collect additional data and analyze the causes.

Fig.12 Accelerometer output distribution (V=15.3 m/s, σ = 0.7)
Conclusion
As a result of examining the evaluations on the detection of cavitation occurrence and the distribution of erosion rates by conducting measurements from outside the piping with the use of accelerometers, we have reached the following conclusions:
In the vicinity of cavitation inception, signals in the high frequency range of 20 kHz to 30 kHz with waveforms resembling sine waves were detected. The characteristics of the output waveforms can be used for identifying cavitation inception. Moreover, in the developed cavitation state, the extent of cavitation intensity can be classified based on the magnitude and incidence of the output waveforms in pulse form.
Comparison results of the erosion rate distribution obtained in the erosion test with the accelerometer output distribution indicate that the tendencies favorably agree with each other, and suggest that the erosion rate distribution may be evaluated with accelerometers from outside the piping. Therefore, local data from inside the piping are considered to be available through the use of accelerometers.
Acknowledgments
The authors wish to express their sincere gratitude for support from Professor Shuji Hattori of Fukui University, who was kind enough to conduct the pretreatment of test specimens in the magnetostrictive vibratory cavitation erosion test device.
References
- Kato, H. (ed.), Cavitation, New ed., Maki-shoten, Tokyo, 1999. (in Japanese)
- Okabe, Y., Kitajima, A., Koishikawa, A., and Takeuchi, Y., Experimental Studies on the Relationship between Erosion Rate and Apparent Impact Pressure and Cavitation Monitoring System by Acoustic Detector, International Symposium on Cavitation, April 1986, Sendai, Japan.
- Yoshida, Y., Kawakami, T., Yamada, I., and Kamide, N., Measurement of Pump Cavitation Impact Pulses by Means of Acoustic Emission Sensors, Turbo Machinery, Vol. 18, No. 6, 1990, pp. 1116. (in Japanese)
- Grand, M. McD. et al. , Int. Conf. on the Use of Micros in Fluid Eng., Paper G3, 1983, London, 271.
- Sato, K., A Study of the Cavitation Process by Means of Acoustic Pulse Measurement, FED-Vol.57, International Symposium on Cavitation Research Facilities and Techniques, 1987, pp. 115121.
- Sato, K., Cavitation Shock Pressures Based on Difference of Bubble Patterns, Transactions of the Japan society of Mechanical Engineers (Volume B), Vol. 56, No. 532, 1990, pp. 35973602. (in Japanese)
