Michael C. Palmer, P.E., M.ASCE1; Thomas D. O’Rourke, M.ASCE2; Nathaniel A. Olson, S.M.ASCE3; Tarek Abdoun, M.ASCE4; Da Ha, M.ASCE5; and Michael J. O’Rourke, P.E., M.ASCE6;
¹ Research Associate, School of Civil and Environmental Engineering, Cornell Univ., Ithaca, NY 14853 (corresponding author).
² Professor, School of Civil and Environmental Engineering, Cornell Univ., Ithaca, NY 14853.
³ Graduate Research Assistant, School of Civil and Environmental Engineering, Cornell Univ., Ithaca, NY 14853.
4Associate Professor, Dept. of Civil and Environmental Engineering, Rensselaer Polytechnic Institute, Troy, NY 12180.
5Project Geotechnical Engineer, Geocomp Corporation, 1145 Massa- chusetts Ave., Boxborough, MA 01719.
6Professor, Dept. of Civil and Environmental Engineering, Rensselaer Polytechnic Institute, Troy, NY 12180.
Note. This manuscript was submitted on April 7, 2008; approved on May 7, 2008; published online on October 15, 2009. Discussion period open until April 1, 2010; separate discussions must be submitted for individual papers. This paper is part of the Journal of Geotechnical and Geoenvironmental Engineering, Vol. 135, No. 11, November 1, 2009.
Abstract: This paper provides an assessment of tactile pressure sensors for geotechnical applications. A tactile pressure sensor is an array of small sensing units, called sensels, embedded in a polymeric sheet or pad that measures the magnitude and distribution of stresses normal to the sheet surface. Methods for minimizing the effects of shear on sensor measurements are discussed and the efficacy of these methods are demonstrated by laboratory experiments. The time-dependent characteristics of the sensors are evaluated and recommendations are provided for measurements that account for time-dependent effects. Tactile pressure sensor measurements in response to vertical loading and unloading and to lateral loads on full-scale pipelines affected by large horizontal ground movements are compared with independent measurements of the loads. Sensor measurements are used to show the distribution of normal stress on pipelines subject to large lateral soil movement.
DOI:10.1061/(ASCE)GT.1943-5606.0000143
CE Database subject headings: Soil-structure interactions; Pipelines; Earthquakes; Assessment.
Introduction
A tactile pressure sensor is an array of small sensors, referred to as sensels, embedded in a polymeric sheet or pad that measure the distribution of normal stresses associated with externally applied loads. They were originally developed to support artificial intelligence but have since been used in industrial and ergonomic applications, including the design of automotive seats and brake pads (e.g., Paikowsky and Hajduk 1997; Tekscan Inc. 2003).
Important research on tactile pressure sensors has been performed by Paikowsky and coworkers (Paikowsky and Hajduk 1997; Paikowsky et al. 2000, 2003, 2006), who were the first to investigate their application for geotechnical purposes. Paikowsky and Hajduk (1997) report on a comprehensive series of sensor tests in granular media. They conclude that the tactile pressure sensor system provides normal stress measurements in granular soil to a good degree of accuracy. They also show that sensor measurements are sensitive to load rate, creep, and hysteresis upon unloading and provide experimental data that help quantify these effects. Tactile pressure sensors have been applied to measure the vertical stress under model strip footings (Paikowsky et al. 2000), vertical stress distribution due to arching during trap door experiments in granular material (Paikowsky et al. 2003), vertical stress distribution beneath a conical pile of sand (Paikowsky et al. 2006), and vertical pressures transmitted by railroad tracks (Stith 2005). Paikowsky and coworkers developed a calibration device for applying controlled granular material pressure to tactile pressure sensors (Paikowsky and Hajduk 1997) and investigated the effects of soil grain size relative to sensel dimensions on sensor measurements (Paikowsky et al. 2006).
Conventional soil stress cells typically register stresses that are either low or high relative to actual soil stresses as a function of stress cell stiffness, size and aspect ratio (thickness-to-length ratio), cell placement procedures, and other factors (e.g., Kohl et al. 1989; Dunnicliff 1988; Weiler and Kulhawy 1982; Selig 1964). Because tactile pressure sensors are thin, wide, and flexible, they possess favorable characteristics with respect to aspect ratio and stiffness. The sensors can be adapted to a variety of surface geometries not possible with soil stress cells and will conform to the curved surfaces of piles, drilled shafts, pipelines, and culverts. They are also affected, however, by limitations related to their construction and material properties. Shear stresses may cause relative slip between polymeric sheets, generating perturbations in the registered voltage. The polymers within the sensor possess viscoelastic characteristics that require an understanding of time-dependent response for calibration and interpretation of measurements.
This paper presents laboratory measurements to help clarify the effects of external shear and creep on sensor performance. Various techniques for minimizing the effects of shear are investigated and a method for isolating the sensor from external shear effects is proposed. Time-dependent characteristics of sensor response are investigated and a measurement process that accounts for time-dependent performance is presented. Tactile pressure sensor measurements in response to vertical loading and unloading and to lateral loads on full-scale pipelines caused by large horizontal ground movement are compared with independent measurements of the loads. Tactile pressure sensors are used to show the distribution of normal stress on pipelines subject to large lateral soil movement.
Tactile Pressure Sensors
The sensors rely on changes in either resistance or capacitance to applied load. They are commercially available from various manufacturers (e.g., Pressure Profile Systems, Inc., Sensor Products, Inc., and Tekscan, Inc.) in many sizes and shapes, with sensel density of 0.3 to over 200 / cm2 sensels.
Tactile pressure sensors manufactured by Tekscan, Inc. were used in this study. A schematic of the sensor system is shown in Fig. 1. The tactile pressure sensor consists of two 0.1- mm-thick polymer sheets, with opposing interior faces that contain rows and columns of resistive ink. The rows and columns of ink overlap at grid points, or sensels, where applied forces are measured. Fig. 2 is a photograph of the tactile pressure sensor (
Tekscan Model 5315). The sensor sheets measure 622 X 530 mm with a sensing region dimension of 488 X 427 mm. The sensor contains 48 columns and 42 rows resulting in 2,016 sensels spaced at 10 mm on center in each direction. It uses proprietary hardware and software to record, convert, and display the sensor readings.
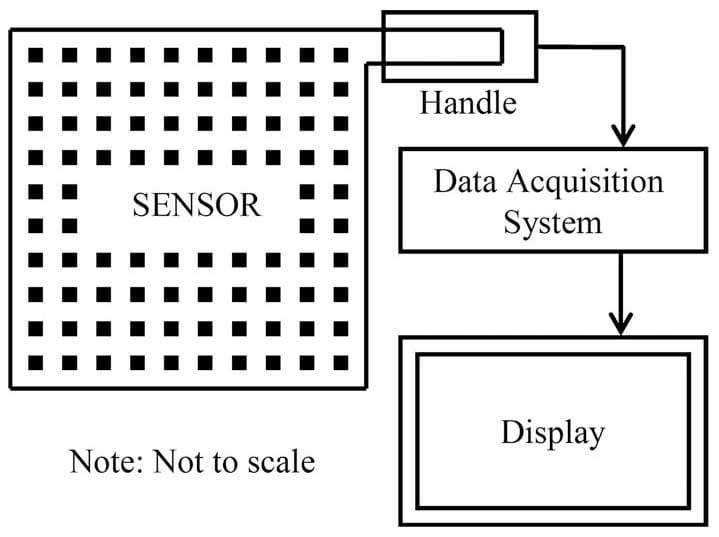
Fig. 1. Schematic of tactile pressure sensor measurement system
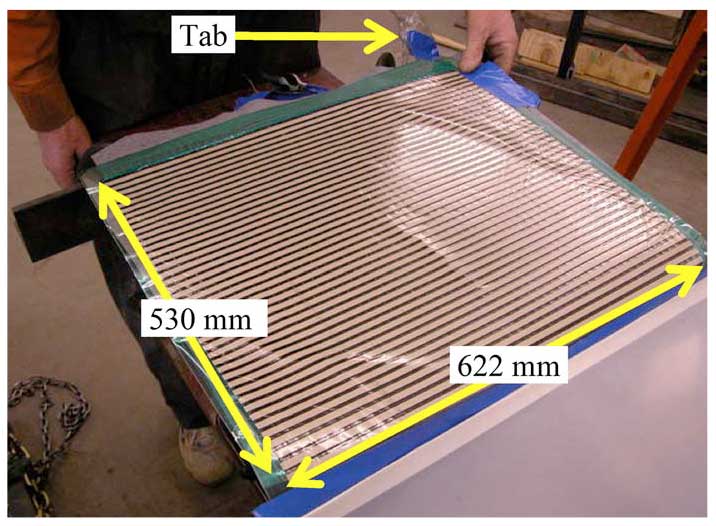
Fig. 2. Photo of a tactile pressure sensor
When normal pressures are applied to the sensor, changes in resistance at the loaded sensels are read sequentially. Resistance change is measured as an analog voltage and then converted to an 8-bit digital number that is transmitted to a data acquisition board. Proprietary software converts the number to pressure in accordance with the sensor calibration. The resulting array of numbers is converted to a colorized distribution of pressure.
Calibration of Sensors
The sensors used in this study require conditioning, equilibration, and calibration before use. Conditioning involves loading the sensor to a level at or above the anticipated test load several times. It reduces the magnitude of drift and hysteresis in the sensor readings and improves repeatability. Typically, the conditioning load is applied as a uniform pressure either with pneumatic or hydrostatic devices.
After conditioning, equilibration is performed. Equilibration involves applying a uniform pressure to the entire active area of the sensor. The software determines a gain or scale factor for each sensel such that the digital output of that sensel is equal to the average digital output of all the loaded sensels. Sensels with a lower original output have their gain increased while those with a higher original output have their gain decreased. This equilibration compensates for differences in sensitivity between sensels due to manufacturing or repeated use of the sensor. Equilibration can be performed using a single- or multiload application.
Calibration of the sensor is performed after equilibration is complete. During calibration, uniform pressures are applied to the sensor that cause changes in the resistance of the loaded sensels. During calibration, the analog reading from the sensel is converted to a digital value, referred to as raw (raw sensor data units). This value is then correlated to engineering units based on the magnitude of the applied pressure.
Sensors are typically calibrated using a one-load or two-load calibration. During a one-load calibration, it is assumed the sensor has zero output under zero applied load. A known load then is applied to the sensor to obtain a single calibration point. A calibration line is obtained by connecting the zero point to the calibration point on a sensor output versus load graph. A two-load calibration uses an initial load and a second higher load. The calibration points are then connected using a power law equation.
Conditioning, equilibration, and calibration were performed in this study by a pneumatic device with an internal urethane bladder that fills with air to apply uniform pressure. The unit includes an analog pressure gauge to monitor applied pressure, a dial valve regulator to apply pressure, and a toggle switch pressure regulator. Each operation using this device can be performed in minutes.
Fig. 3 presents calibration plots for a typical sensor with an inset plot showing the response versus time for various levels of applied pressure. The manufacturer’s recommended calibration procedure is (1) condition the sensor by loading and unloading three to five times to 120% of the expected peak load; (2) equilibrate at midrange of the expected peak load; and (3) calibrate at either one (one-load calibration) or two applied pressures (two-load calibration). Typically, the calibration pressures are held for about 1 min or until the pressure appears to stabilize as viewed with the visualization software.
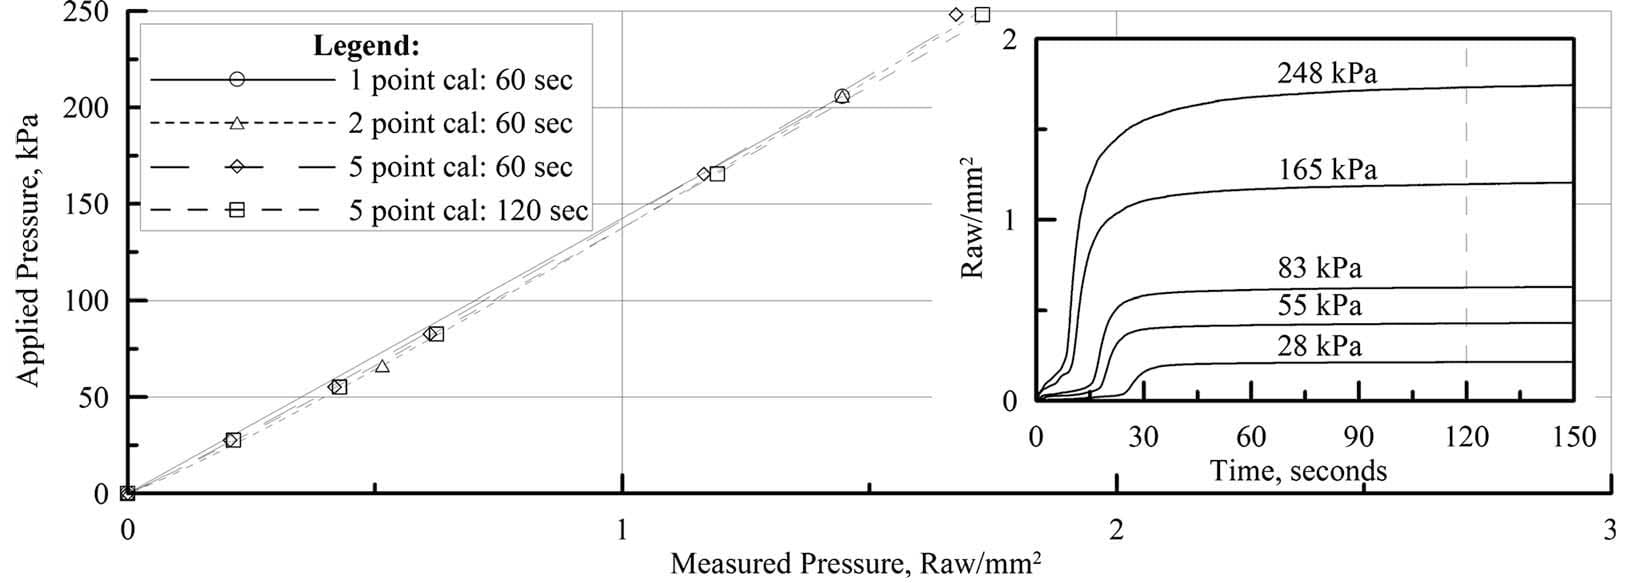
Fig. 3. Comparison of tactile pressure sensor calibration and response versus time plots
The inset plot of Fig. 3 shows data for a detailed calibration of a sensor at five different levels of applied pressure. The measured sensor response in raw / mm2 with respect to time is nonlinear and yields a different pressure calibration depending on the time chosen for holding the load. Frequently, times between 60 and 120 s are selected for calibration because there is very little change in measured load during this interval. In this study, it was found that the sensor response is well characterized by a conventional creep model for load duration beyond 120 s.
Four calibration curves are plotted in Fig. 3 corresponding to four different calibration techniques. Curves for one-load and two-load calibrations determined according to the manufacturer’s recommendations are plotted relative to five-load calibrations in which the sensor was calibrated more rigorously at five different pressure levels. After each equilibration and calibration, the pressure was reduced to zero for 1 h to allow for relaxation, then pressurized higher for the next level of equilibration and pressurization. Two five-load calibrations were performed by holding the applied load for 60 and 120 s.
Fig. 3 shows that the two- and five-load regression plots are statistically indistinguishable from each other at a 95% confidence level. The one-load plot overestimates at all applied pressure, especially at pressures less than or equal to 25 kPa where the one-load pressure may exceed the two- and five-load calibration pressures by as much as 25%.
Shear Stress Effects
Tactile pressure sensors are designed to measure normal stress only. Sensor manufacturers do not provide methods to account for or quantify shear effects and user manuals typically recommend reducing or eliminating shear transferred to the sensor. Shear stresses can displace one sheet of the sensor relative to the other, damage the sensor, and result in inaccurate normal stress readings.
To evaluate the effects of shear stresses on sensor measurements, direct shear tests were performed on the sensors. Before testing, the sensors were conditioned, equilibrated, and then calibrated using a two-load method. Fig. 4 shows a schematic of the testing apparatus. The direct shear tests were designed for normal stresses of 43 to 161 kPa. As illustrated in the figure, iron weights were suspended on a steel hanger to convey normal force to the sensor. A motorized or hand-operated jack was placed in contact with the upper steel plate and displaced horizontally until it caused movement. The jack displacement, applied horizontal force, and force measured by the tactile pressure sensor were monitored continuously.
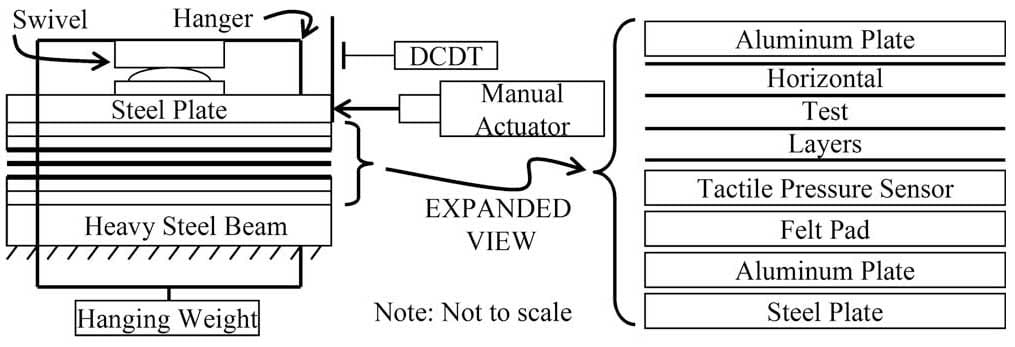
Fig. 4. Schematic of testing apparatus to evaluate shear stress effects on tactile pressure sensor measurements
The expanded view in Fig. 4 shows the horizons of plates and sheets that were tested. In all cases, there were two 12-mm-thick aluminum plates positioned at the top and bottom of the layers. Also, a 3-mm-thick sheet of felt was positioned on the bottom aluminum plate, on top of which was the tactile pressure sensor sheet. The horizontal test layers refer to the horizontal polymer sheets that were located on top of the tactile pressure sensor. Table 1 summarizes the different test layers that were investigated and number of tests associated with each layered system. It also provides a brief description of the measured normal force during the appli
cation of shear. Six different layered systems were evaluated, including a single sheet of low density polyethylene (LDPE), LDPE sheet in combination with a rubber sheet, two LDPE sheets, two LDPE sheets with an intervening layer of Te- flon spray lubricant, two sheets of LDPE, one sheet of LDPE overlying one sheet of Teflon, and two sheets of Teflon.

Table 1. Summary of Shear Test Results
Fig. 5 presents representative results for two-layered systems.
Two plots of data are shown for each test. The upper plot shows the ratio of the applied shear stress to applied normal stress versus horizontal displacement. The lower plot shows the ratio of the measured normal stress to applied normal stress versus shear displacement. Fig. 5(a) shows the effects of shear stress for a single sheet of LDPE above the sensor. The normalized normal force, which should equal one with no shear effects, drops rapidly to 0.7 when shear displacement occurs and then slowly rises back toward one.
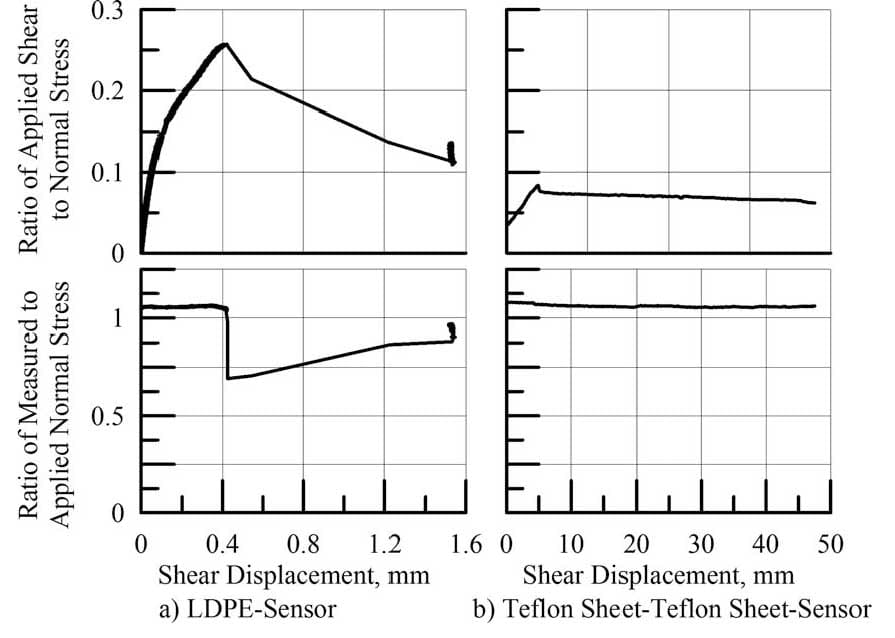
Fig. 5. Plots of the ratio of applied shear to normal stress and the ratio of measured to applied normal stress versus displacement for various protective polymer sheets
Fig. 5(b) shows the results for two layers of Teflon sheets placed above the sensor to create a low-friction sliding plane. The normal force was basically unchanged during shear, demonstrating the success of this method in providing protection against shear effects. As indicated in Table 1, Teflon spray lubricant between two sheets of LDPE was also effective in reducing shear effects. However, the thixotropic properties of the lubricant led to increased shear resistance over time and prevented it from being useful in applications with significant time delays (several hours) between lubricant application and initiation of shear.
Time-Dependent Effects
Tactile pressure sensors are known to experience drift or creep when measuring an applied load. Drift is reported to vary from 0–3% of applied load per log time (Tekscan Inc. 2003). To evaluate the time-dependent effects, sustained loading tests were performed. Before testing, the sensors were conditioned, equilibrated, and calibrated using the two-load method described earlier. Weights, which were hung from a crane with a load cell attached, were applied to the sensor by means of a loading assembly similar to that in Fig. 4. Load cell measurements were taken continuously during and after load application. Loads were held constant for more than 1,200 s to acquire measurements for several log cycles of time.
Fig. 6 shows the results of five tests plotted as the ratio of measured to applied pressure versus log time for applied pres- sures of 15 to 151 kPa. The application of pressure to about 2 s is followed by a transition to creep at 120 s. For applied pressures of 49–151 kPa, the pressure ratio versus log time plots are tightly grouped, especially at times less than 120 s. At 60 and 120 s, the pressure ratios plot at or slightly below and at or slightly above 1.0, respectively. The maximum difference in the pressure ratios at 60 and 120 s is about 10%.
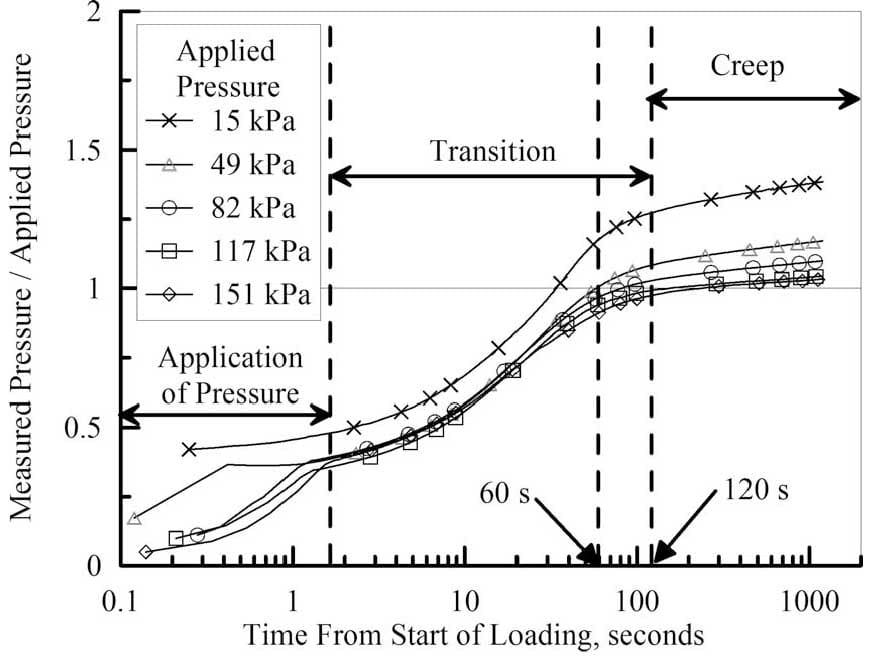
Fig. 6. Results of load response time tests using two-point calibration
It should be noted that the pressure ratio versus log time plot at a low pressure of 15 kPa is significantly above the trends at higher applied pressures. This type of behavior was observed for many sensors in this study and is consistent with observations by Paikowsky and Hajduk (1997), who reported inaccurate measurements at low applied pressures. In general, it was found that pressure exceeding 15% of the upper range of the sensor is required for the most reliable and consistent measurements.
The change in measured pressure, tip, after 120 s can be expressed as

in which a = coefficient of creep, reported in units of kPa per change in log time; and t1 and t2=times during creep where t2 > t1.
Fig. 7 shows a plot of the creep coefficient, a, determined at 120–1,200 s after loading versus the applied pressure. The plot was developed with data from 25 tests performed, as described above, using two different sensors with applied pressures between 15–151 kPa. The creep coefficient increased from about 0.8 to 3.5 kPa per change of log time as the applied pressure increased from 15 to 150 kPa.
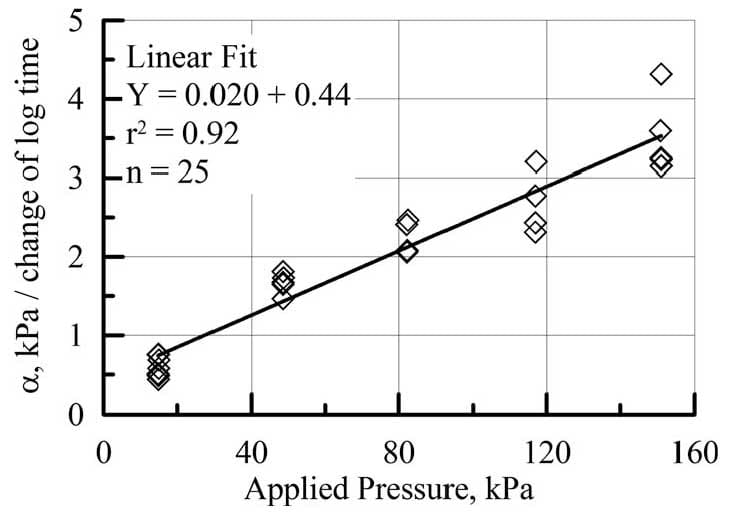
Fig. 7. Creep response versus applied pressure
The data in Figs. 6 and 7 illustrate two important characteristics. First, sensor measurements are within 10% of applied pres-sure 60 to 120 s after loading for pressure exceeding 15% of the upper sensor range. Second, the onset of creep begins at approximately 120 s after loading. Sensors calibrated at 120 s provide reasonably accurate measurements at an equal time following load application, after which Eq. (1) can be used to characterize sensor response in terms of creep. The pressure change, tip, from Eq. (1) should be subtracted from the measured pressure over time to correct for sensor creep and estimate the actual applied stress.
Measurement of Vertical Loading and Unloading
Tactile pressure sensors were loaded and unloaded using the procedure illustrated in Fig. 8 in which lower and upper pallets holding lead blocks were placed in contact with the sensors. The load was applied for 120 s, after which the upper pallet and blocks were removed to reduce part of the load. The sensors were positioned in a layered assembly of protective felt and aluminum plates similar to the arrangement depicted in Fig. 4.
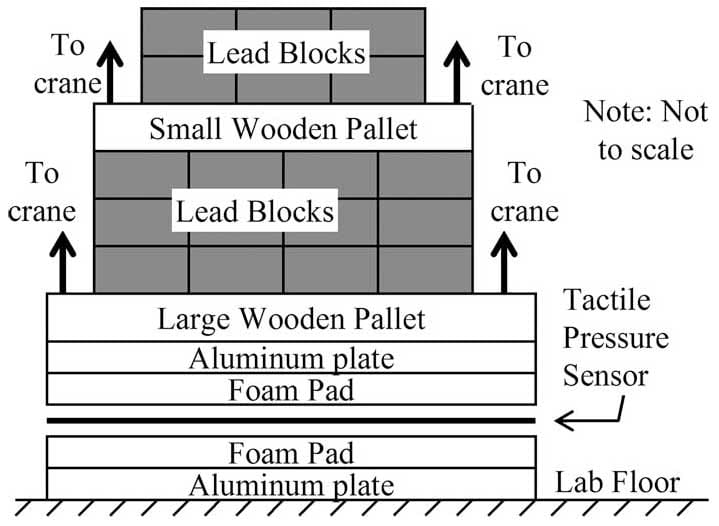
Fig. 8. Schematic of test for vertical loading and unloading of tactile pressure sensors
The measured and applied pressures for two different sensors (A and B) are plotted versus time in Fig. 9. Measured pressures using both two- and five-load (at 120 s) calibration plots are presented. Consistent with the calibration plots in Fig. 3, there is no clear difference in the tactile pressure sensor response for two- and five-load calibrations. The measured pressures increased nonlinearly with time and at 120 s were between 4 and 9% below the applied pressure. After partial unloading, the measured pressures fell rapidly until they were ±2% of the applied pressure after 120 s.
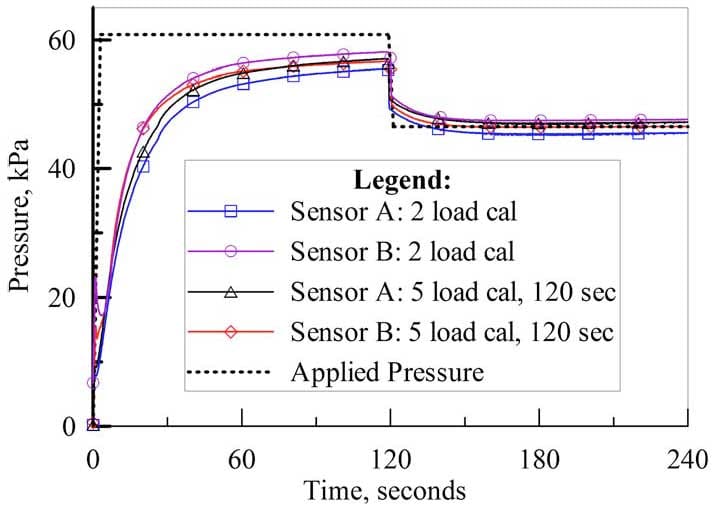
Fig. 9. Comparison of measured and applied forces for vertical load- ing and unloading tactile pressure sensors
These measurements corroborate performance demonstrated earlier in the paper and show a favorable comparison between measured and applied pressure, provided the comparison is made at a time after loading consistent with that used in the calibration of the sensor. Moreover, the measured versus applied pressures compare favorably after partial unloading, showing that the sensors can provide reliable measurements for simple unloading stress paths.
Measured versus Applied Loading during Large-Scale Tests
Tactile pressure sensors have been used in full-scale three-dimensional (3D) tests of ground rupture effects on buried pipelines and two-dimensional (2D) tests of pipelines under horizontal ground displacements at full
-scale and in the centrifuge (Ha et al. 2008; O’Rourke and Bonneau 2007; O’Rourke et al. 2008). The combined tests were part of a research program using the experimental facilities of the George E. Brown Jr., Network for Earth- quake Engineering Simulation (NEES) (O’Rourke et al. 2008; Palmer et al. 2006) to improve design for soil-pipeline interaction under large ground deformation.
Measurements by Paikowsky and Hajduk (1997) of tactile pressure sensor response as a function of loading rate in granular media provide valuable insight about sensor performance. Paikowsky and Hajduk compared the applied pressure and sensor output at loading rates between 1 and 10 kPa/s. They developed calibration procedures, based on linear regressions of applied stress and sensor output versus time for various loading rates, and showed that the calibration procedures produce measurements to within ±10% of the applied pressure for monotonically increasing load and applied pressure exceeding 100 kPa.
The soil-pipeline interaction tests for large ground deformation at the NEES sites provided the opportunity to explore further sensor response under variable loading rates. A constant rate of horizontal movement of 2.5 mm/s was imposed in large-scale 2D tests of buried pipelines instrumented with tactile pressure sensors. Lateral forces on the pipes were measured independently of the sensors. No special sensor calibrations were performed to account for load rate effects. The intention was to compare directly the loads taken independently with those measured by the sensors using the two-load calibrations described previously. A favorable comparison between the two measurements would allow for easier and more expeditious use of the sensors. Moreover, the opportunity would still exist for more detailed calibrations, such as those described by Paikowsky and Hajduk (1997), to further improve accuracy with respect to load rate effects.
In addition, the soil-pipeline interaction tests provide measurements of pressure distribution on the pipe as a function of relative movement between soil and pipe. The measurements show how pressures develop around the pipe progressively as relative displacements increase.
Fig. 10 presents a schematic of the large-scale 2D test basin, which was filled with poorly graded glaciofluvial sand placed in both dry and partially saturated conditions and compacted in 200-mm lifts. The median grain size was 0.7 mm, which is over one order of magnitude smaller than the 10 X 10 mm sensels. Detailed information about the grain size characteristics, mineralogy, and strength properties of the sand are described elsewhere (O’Rourke et. al. 2008). Multiple soil-structure interaction tests were performed using the test basin and sand with different dry densities and water contents, different peak angle of shear resistance as determined by direct shear tests, <tds-p, and different ratios of pipe centerline depth to external pipe diameter, Hc / D.
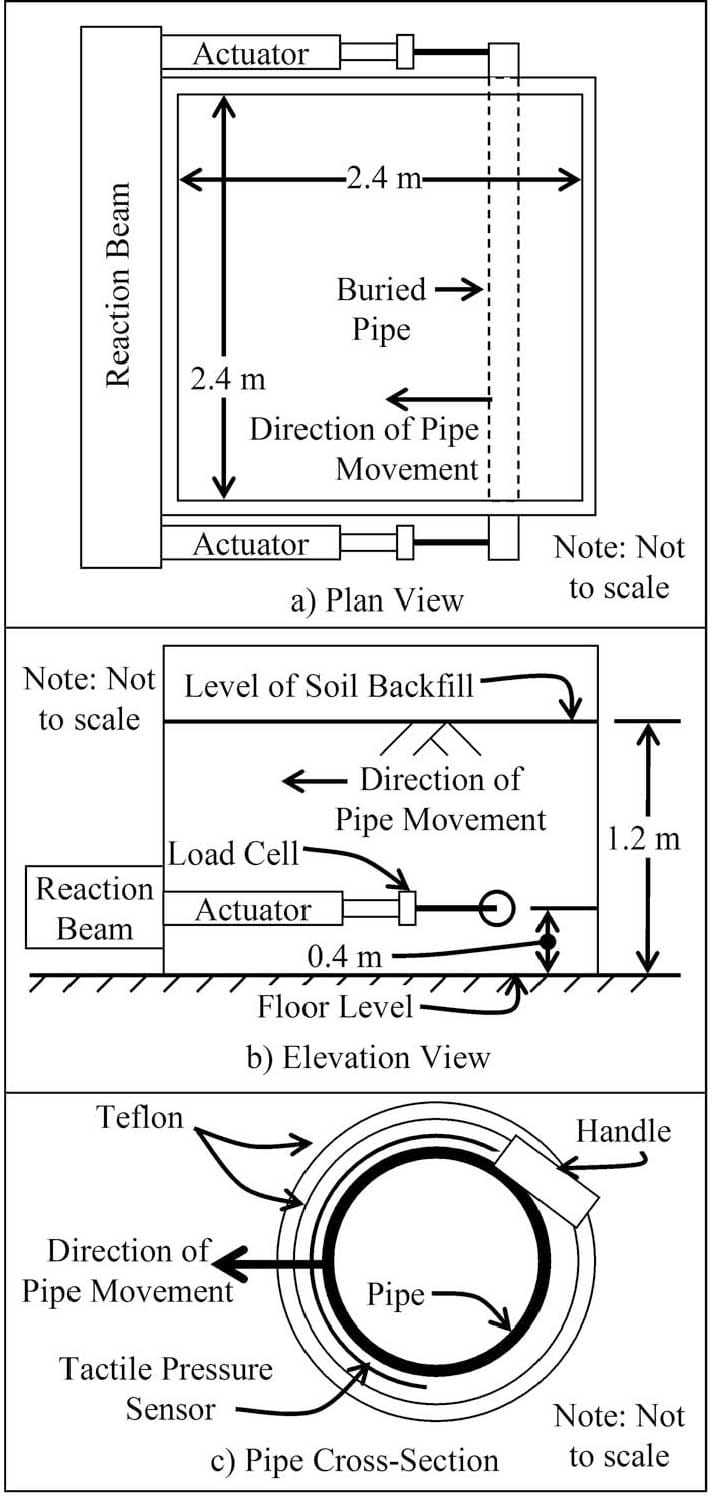
Fig. 10. Schematic of 2D test basin for horizontal force versus displacement of underground pipelines
The basin was designed to measure the lateral force versus displacement of pipelines through the application of horizontal force with the two long-stroke (1.2 m in one direction) hydraulic actuators as shown in the figure. Horizontal force was measured on each side of the box with a load cell and lateral movement was measured with Temposonic displacement transducers that provide a voltage output that corresponds to displacement. The loading arm was designed so that the test pipe could rise without vertical restraint as it was displaced laterally through the soil. The rate of pipe displacement was 2.4 mm/s. The test basin and loading conditions were similar to those used in previous full-scale tests (e.g., Trautmann and O’Rourke 1985; O’Rourke et al. 2004) with the main exception of size. The internal dimensions of the test basin were 2.44 m X 2.44 m in plan and 1.82 m in depth. The end effects of wall friction were minimized by the relatively large width of the test basin and by lining the interior of the box with Formica and glass, both of which provide for relatively low angles of interface friction.
Tests were performed on pipelines 120 and 150 mm in nominal diameter, buried at a pipe centerline depth to diameter ratio, Hc / D, between 3.5 and 7.5. The test pipes had a 2.5-mm-thick high density polyethylene (HDPE) external coating, which is a typical coating used for pipelines in the field. Soil density was strictly controlled with over 100 nuclear density gauge measurements per test and a similar number of oven-dried water content measurements when partially saturated sand was used.
As illustrated in the pipe section view of Fig. 10(c), tactile pressure sensors were placed on the pipe and covered with a double layer of 0.5-mm-thick Teflon sheets. The outer layer of Teflon was wrapped around the pipe, but not secured, to allow rotation and sliding during the test. As described previously, the sensor sheets had a 488 X 427 mm sensing region with 2,016 sensels spaced at 10 mm on center in each direction. Prior to installation, the sensors were conditioned and calibrated at load rates similar to the rate of loading during full-scale tests. A two-load calibration was used and sensor readings were continuously recorded during the tests.

Fig. 11. Soil-pipe interaction model
Fig. 11 shows that the stress applied to the sensor has varying magnitude and direction. Measurements of soil movement relative to the pipe in large-scale tests show soil displacement along the pipe surface that mobilizes surface shear stresses consistent with the pattern, illustrated in Fig. 11(a) (O’Rourke et al. 2008). Letting p denote the soil pressure per unit length along the pipe and f denote the frictional force between soil and pipe per unit length, the total force per unit length acting on the pipe is obtained by combining p and f appropriately. The frictional force per unit length is given by f(8) = p(8)tan 8SI sin 8, where 8SI is the interface friction angle between the pipe and soil. The net force acting on the pipe surface in the transverse horizontal direction, Ph, is given by

The net force per unit length can also be obtained from the ex- perimental data using the following relation:

Fig. 12 shows the normal stress distribution measured by tactile pressure sensors at various stages during lateral loading for a test using dry sand with unit weight of 17.2 kN / m3, D = 120 mm, and Hc / D = 5.5. The peak friction angle of the sand, < t’ds-p, measured in a conventional 60 X 60 mm direct shear testing device in accordance with ASTM D3080-04 (ASTM 2004), was 44°. Two tactile pressure sensors were used during the test. One was positioned between 90–520 mm from the end of the pipe and is referred to as the side sensor. The other, positioned between 1,000–1,430 mm from the end of the pipe, is referred to as the centerline sensor. The measured pressure distributions are shown at lateral displacements of the test pipe of 15, 25, and 120 mm, corresponding to a prepeak, peak, and postpeak loads on the pipe. For the 120-mm diameter pipe, the sensel width of 10 mm corresponds to about 9° of arc length. Thus, the pressure distribution is shown as 19 discrete measurements around the pipe. Virtually all pressure was confined to the front half circumference of the pipe. < /p>
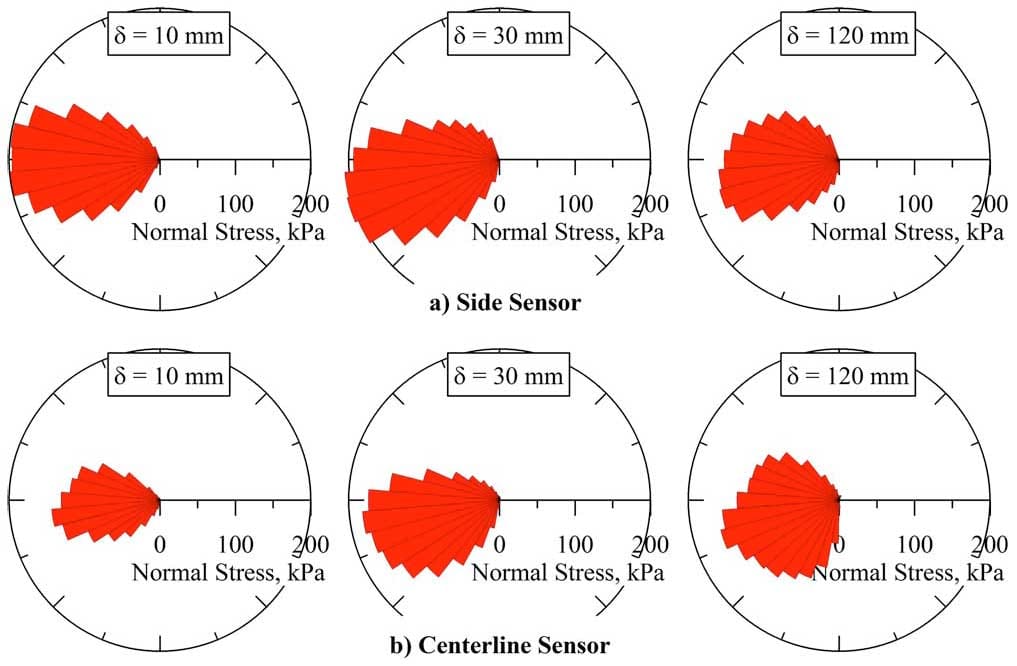
Fig. 12. Distribution of normal pressure from tactile pressure sensors
At low levels of relative displacement (8 = 10 mm) the pressure distribution is uniform. At higher levels (8 = 30 mm) the pressure distribution is skewed, with higher pressures in the lower leading quarter of the pipe surface. This change in distribution pattern is consistent with vertical rise of the pipe that begins near peak load (8 = 30 mm) when the pipe begins to move horizontally and vertically to follow the failed soil mass in front of the pipe. The increased vertical force associated with rise of the pipe is reflected in the elevated pressure along the lower leading quarter of the pipe.
Fig. 13 shows the lateral force versus displacement plot developed from the tactile pressure sensor measurements in comparison with that developed from the load cell measurements external to the test basin, as described above. Inset photos show the tactile pressure sensor on the pipe and Teflon protective cover. Also shown is the lateral force versus displacement plot for the same pipe with HDPE coating, but without sensors, as measured by the external load cells. This plot was developed for the same sand and Hc / D. The sand unit weight was 16.9 kN / m3, with < t’ds-p = 42°, which is very close to the corresponding unit weight and friction angle of sand used to test the pipe with tactile pressure sensors and protective Teflon covers.
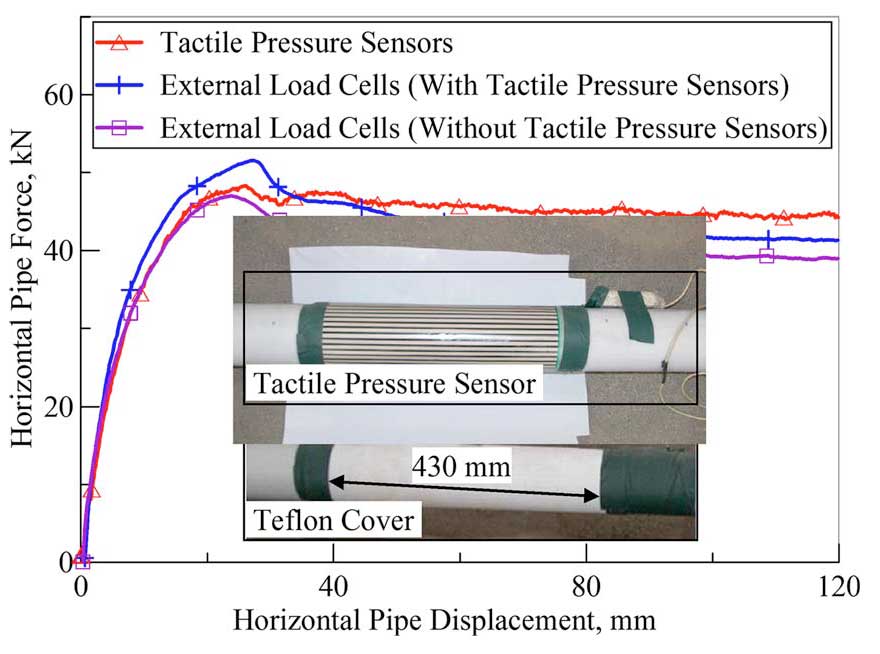
Fig. 13. Comparison of horizontal displacement for nominal 100-mm diameter pipe
There is only a small difference of 10% in peak horizontal force for the pipes with and without sensors and that difference is well explained by the difference in unit weight and friction angle. It appears therefore that the sensors and protective covers did not alter the horizontal force with respect to the pipe without sensors. All horizontal force measurements using pipe with sensors were compared in dimensionless charts with data acquired in other 2D tests using pipe without sensors (O’Rourke et al. 2008). No significant variation in force or deviations from the trends of the data have been observed for pipe with and without sensors.
The horizontal force for each sensor at each increment of lateral displacement was calculated from the measured pressure distribution using Eq. (3). The angle of interface shear, 8SI, for sand on Teflon was determined from direct shear tests and the correlation between 8SI / < t’ds-p and Shore D hardness established by O’Rourke et al. (1990) for smooth polymers in contact with granular soil. The value of 8SI so determined is 29°. The measured forces from the two sensors were averaged at each movement increment to produce the horizontal force versus lateral displacement plot for the tactile pressure sensors.
Frictional forces generated along the side walls of the test basin were carefully evaluated by special tests in which the sliding mechanism for lateral movement of the test pipe was subjected to measured horizontal loads while the lateral resistance to sliding was measured. During these tests, tactile pressure sensors were used to measure the forces normal to the interior sides of the box. Those forces were converted to horizontal resisting forces by multiplying the normal force by tan 8SB, where 8SB is the interface friction angle between the soil and the Formica and glass surfaces of the box interior. Tests with the 60 X 60 mm direct shear apparatus indicate that 8SB is about 25° for the interface between the test sand and both Formica and glass. The wall friction force was subtracted from the horizontal force measured by the external load cells to provide the actual lateral force on the pipe. In general, the correction for end shear effects at peak horizontal load was less than 6% of the measured lateral load.
Conclusions
The use of tactile pressure sensors, where soil-structure interaction shear forces are present, will result in damage to the sensor or inaccurate readings of normal stress. A protective system that includes two layers of Teflon was found to protect the sensor and reduce greatly the effects of shear stress on sensor measurements.
Test results show that sensor measurements are within 10% of applied pressure 60 to 120 s after loading for pressure exceeding 15% of the upper-bound sensor pressure. The results of this study corroborate the findings of other investigators (e.g., Paikowsky and Hajduk 1997) that measurement inaccuracies increase for pressure levels less than about 15% of the maximum pressure range.
The accuracy of measurements with tactile pressure sensors compares favorably with that of conventional soil stress cells. Tactile pressure sensors have additional benefits by providing distributed stress measurements over relatively large surfaces and adapting to various surface geometries not possible with conventional stress cells.
Creep of the sensor measurements begins at approximately 120 s after loading. Sensor response for longer durations of measurement is characterized by a conventional creep equation in which the increment in measured pressure is equal to the product of a creep coefficient and the change in log time. This apparent pressure should be subtracted over time from the measured pressure to estimate the actual applied pressure.
The 2D soil-structure interaction tests were performed with tactile pressure sensors wrapped around a pipe that was buried in sand and displaced laterally. P-y curves generated from sensor data compare well with those derived from independent measure- ments of the applied loads. Methods are provided herein for resolving normal stresses on the pipe from sensor measurements and for determining the horizontal force on the pipe.
On the basis of the test results acquired in this study, tactile pressure sensors are suitably accurate and versatile for reliable measurement of normal stresses in large-scale laboratory and centrifuge tests of soil-structure interaction. Care, however, must be taken to eliminate or mitigate shear stresses transmitted to the sensor surface and to account for time-dependent sensor response to applied pressure.
Acknowledgments
This work was supported primarily by the George E. Brown Jr. NEES Program of the National Science Foundation under Grant No. CMS-0421142. Any opinions, findings, and conclusions or recommendations expressed in this material are those of the writ- ers and do not necessarily reflect the views of the National Science Foundation. This project is part of a collaborative project involving full-scale buried pipe tests at Cornell University and companion centrifuge tests at Rensselaer. The writers thank Mr. Tim Bond and Mr. John Davis of the Cornell University Civil Infrastructure Lab and Mr. Joe Chipalowsky and Ms. Qinge Ma of the Cornell University NEES equipment site for their valuable assistance in the setup and performance of the tests. The writers also recognize Cornell University Ph.D. candidate Jeremiah Jezerski for his assistance in performing the tests on the sensors.
References
- ASTM. (2004). “Standard test method for direct shear test of soils under consolidated drained conditions.” ASTM D3080-04, West Conshohocken, Pa.
- Dunnicliff, J. (1988). Geotechnical instrumentation for monitoring field performance, Wiley, New York.
- Ha, D., et al. (2008). “Centrifuge modeling of earthquake faulting effects on buried HDPE pipelines crossing fault zones.” J. Geotech. Geoen- viron. Eng., 134(10), 1501–1515.
- Kohl, K. M., New, B. M., and O’Rourke, T. D. (1989). “Stress cell measurements for the investigation of soil-pipeline
interactions during vehicular loading.” Proc., Geotechnical Instrumentation in Civil En- gineering Projects, Univ. of Nottingham, Nottingham, U.K. - O’Rourke, T. D., et al. (2008). “Geotechnics of pipeline system response to earthquakes.” Proc., 4th Decennial Geotechnical Earthquake Engi- neering and Soil Dynamics Conf. (GEESD IV), ASCE, Sacramento, Calif.
- O’Rourke, T. D., and Bonneau, A. (2007). “Lifeline performance under extreme loading during earthquakes.” Earthquake geotechnical engi- neering, K. D. Pitilakis, ed., Springer, New York, 407–432.
- O’Rourke, T. D., Druschel, S. J., and Netravali, A. N. (1990). “Shear strength characteristics of sand-polymer interfaces.” J. Geotech. Engrg., 116(3), 451–469.
- O’Rourke, T. D., Wang, Y., and Shi, P. (2004). “Advances in lifeline earthquake engineering.” Proc., 13th World Conf. on Earthquake En- gineering, Canadian Association for Earthquake Engineering, Vancou- ver, Canada.
- Paikowsky, S. G., and Hajduk, E. L. (1997). “Calibration and use of grid-based tactile pressure sensors in granular material.” Geotech. Test. J., 20(2), 218–241.
- Paikowsky, S. G., Palmer, C. J., and Dimillio, A. F. (2000). “Visual observation and measurement of aerial stress distribution under a rigid strip footing.” Geotech. Spec. Publ., GSP 94, 148–169.
- Paikowsky, S. G., Rowles, L. E., and Tien, H. S. (2003). “Visualization measurements of stress around a trap door.” Proc., 12th Pan Ameri- can Conf. and 39th Rock Mechanics Symp., VGE Publications, Cam- bridge, Mass., 1171–1177.
- Paikowsky, S. G., Palmer, C. J., and Rowles, L. E. (2006). “The use of tactile sensor technology for measuring soil stress distribution.” Proc., GeoCongress 2006–Geotechnical Engineering in the Information Technology Age, ASCE, Atlanta.
- Palmer, M. C., O’Rourke, T. D., Stewart, H. E., O’Rourke, M. J., and Symans, M. (2006). “Large displacement soil-structure interaction test facility for lifelines.” Proc., 8th US National Conf. on Earthquake Engineering and 100th Anniversary Earthquake Conf. Commemorat- ing the 1906 San Francisco Earthquake, EERI, San Francisco.
- Selig, E. T. (1964). “A review of stress and strain measurement in soil.” Proc., Symp. on Soil-Structure Interaction, Univ. of Arizona, Tucson, Ariz., 172–186.
- Stith, J. C. (2005). “Railroad track pressure measurements at the rail/tie interface using Tekscan sensors.” MS thesis, Univ. of Kentucky, Lex- ington, Ky.
- Tekscan, Inc. (2003). “Tekscan I—Scan equilibration and calibration practical suggestions.” Tekscan Inc., South Boston, Mass.
- Trautmann, C. H., and O’Rourke, T. D. (1985). “Lateral force- displacement response of buried pipe.” J. Geotech. Engrg., 111(9), 1068–1084.
- Weiler, W. A., and Kulhawy, F. H. (1982). “Factors affecting stress cell measurements in soil.” J. Geotech. Engrg., 108(GT12), 1529–1548.


