


Visualization of Impact Force Using Pressure Sensitive Film Prescale
Kinya Ogawa
Space Dynamics Laboratory, LLC
(Visiting Professor of Ritsumeikan University)
I . Introduction
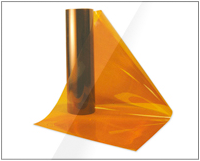
The pressure sensitive film coated by micro-capsuled coupler is developed under pressure and is well known as a non-carbon type copying paper. The film is used to mark an impacted point on a bat in baseball and on a head of golf club, so, it is relevant to demonstrate the effectiveness of this kind of film to evaluate impact force and dynamic pressure distributions. The film, "Prescale'',(supplied by Fuji Film Co. Ltd. Japan) is coated by coupler capsuled in various sizes as shown in Fig. I and is developed in corresponding depth of color to applied pressure. Microstructure of the film is typically shown in Fig.2, and combination of various sized micro-capsules can be seen, since smaller capsules may fracture at higher pressure.
2. Specimen and Experimental Procedures
Four kinds of pressure sensitive film, ' Prescale' (Fuji Film Co.Ltd), type-LW for low pressure, type-MW and type-MS for intermediate pressure, and type-HS for high pressure, were tested. In the cases of the type-LW and the type-MW, coupler and developer in various sized micro-capsules are separately coated on respective sheets, while the micro-capsuled coupler and developer are both coated on the same sheet in the cases of the type-MS and the type-HS. Thickness of the respective films is (90 + 5) µm . A film specimen was lapped( covered) with two PET (Polyethylene Terephthalate of 70 µm in thickness ) films on the top and bottom surfaces and was inserted between two flat platens of 20mm in diameter. Using a universal testing machine, applied pressure was gradually increased up to the certain value in 2minutes, and was kept for 2 minutes before relieved in 5 to 10 seconds. The relation between the static pressure and developed color density was evaluated for the respective films. Impact pressure was applied using a split Hopkinson pressure bar apparatus as shown in Fig.3. A striker bar, an input bar and an output bar are aligned, and a specimen to be tested is set between the input and the output bars as shown. When a striker bar hits the end of the input bar, longitudinal elastic stress wave is generated as the incident wave of which duration is determined by the length of striker, and propagates down the input bar to the distal end of the input bar. A part of the incident wave will be reflected at the end of the input bar and the rest of it is transmitted to the specimen. When the transmitted stress wave reaches at the end of the output bar, a part of it is
reflected and the rest is
transmitted to the output bar as the transmitted stress wave. Thus, the stress wave in a
specimen goes up and down, and is reflected and transmitted again and again at the both
ends of the input and the output bars, yielding the reflected and transmitted stress waves
in the input and the output bars, respectively. The velocities, υ1 and υ2 , at the ends
of the input and the output bar facing to the specimen are given by the following
equation in terms of the incident, the reflected, and the transmitted stress waves, σ1,
σR, and σT, respectively.

where c is the velocity of longitudinal elastic wave in a bar, and p is the density of the
input and the output bars. The average values of the strain rate i, and the strain &
and the stress e5 of the specimen are given as

A and Ao are the sectional areas of the bar and the specimen, and lo is the initial
length of the specimen, respectively. When the stress on the both sides of specimen is
identical, the relation as e51 + e5 R = e5T 1s confirmed, and the above equations are
reduced as

In the present, an input and an output loading bars of 20mm in diameter are smoothly
supported by slide bearings as indicated in the figure, and the both ends of the loading
bars are sufficiently flattened to obtain uniform impact pressure over the test area. To
minimize a possible bending moment inevitably encountered in this kind of experiment,
the bars are carefully aligned, and an end of the striker bar is slightly rounded to make a
good contact with the input bar at the center of the impacted surface. The pressure
sensitive film is inserted between the input and the output bars as shown, and several
trial impacts are applied before the test to ascertain a good contact over the test area by
checking an impression left on the film.
An incident, σReflected, and σTransmitted stress waves are sensed by the strain gages
at given positions in the figure, and are recorded in a multi-channels transient recorder
in digital form. Since the thickness of pressure sensitive film is very thin, and also a
strain rate effect on the specimen is out of consideration, only the stress of specimen
named as the impact pressure, Pa, is evaluated by the equation (4)'.
3. Results and Considerations
Fig.4 shows an example of the incident, reflected, and transmitted stress waves detected by the strain gages. The rectangular shaped incident wave of 10-15 /1 s sharp rise time was applied to the specimen, and the corresponding transmitted stress wave of almost the same magnitude and duration propagated to the output bar. Only at the beginning of the loading, a small amount of reflected wave was detected due to a possible initial clearance between the specimen and the loading bars. Thus, the specimen was compressed for about 200 11 s under constant impact force.
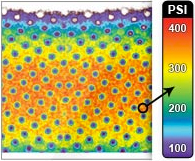
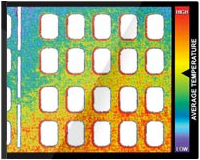
Fig.5 represents an example of the impressions left on the film, type-MW, under impact and the pressure distributions are shown by coloring. The size of impression was slightly larger than that of the loading bar, and this may be reasonably understood by considering additional surrounding excess regions on the edge of the pressured area probably formed due to squeezing out of couplers. The area of this impression is evaluated as 325mm2, while the area is reduced to 303mm2, when the area of pressure less than 1 OMPa, the minimum sensitivity of pressure, is excluded. Therefore, about half of the area of pressure less than l OMPa should be reasonably counted as the contact area, since the area of the loading bar is 314mm2. Thus, it is somewhat difficult to ascertain the true contact area, but it may be verified that the pressure sensitive film can promptly respond even for the impact pressure.
The distribution of the pressure is not perfectly uniform over the impacted area and it is noted the depth of color is slightly lighter in the edge area. Fractions of respective areas at pressure, Pe, evaluated are shown in Fig.6, and half value width at the maximum measures ±2MPa as for the accuracy of the experiment. Therefore, even though the pressure does not distribute perfectly uniform, the averaged value over the area is used for the pressure Pe for the respective applied pressure.
Fig. 7 shows the relation between pressure sensit ivity and elapsed time after impact in the case of type-LM fo r respective applied pressure. In the case of high pressure, measured depth of color significantly changed and faded, while in the case of low applied pressure, it does not change so much even for σRelatively long elapsed time. Reason for these phenomena is not well explained, but it should be noted that a measurement has to be done punctually after loading.
Fig.8 represents the relation between the applied pressure Pa and the evaluated pressure Pe for respective specimens. In the case of type-LM, and type-MS, measured depth of color is dependent on the time elapsed after the test as described above, and solid and open circles represent the data measured at l0min and 103min after loading, respectively. In the case of type-MS and type-HS, there is not any significant change of depth during measurement. Respective single curve for the solid and open circles can be drawn for the respective materials, and can be used for visually evaluating impact pressure through measurement of color depth developed on the pressure sensitive film. It should be noted that the depth of color is significantly reduced in the case of impact pressure comparing to the static loading, and consequently, the evaluated pressure is always lower than the applied pressure. Especially in the high pressure range, depth of the developed color does not increase for all the materials, and sensitivity in this range is much less than the low pressure range. This fact indicates that fracture stress for sma Iler capsules much more significantly depend on the duration of pressure; sho1ter the duration, higher the fracture stress. In the cases of LW and MW, sensitivity is much less than the MS and HS, and this may be due to insufficient contact time for coupler to be developed in such a short duration as 200μs
4. Concluding remarks
Impact pressure was applied to four kinds of the pressure sensitive film, "Prescale" (Fuji Film Co.Ltd.) and the sensitivity of its response was identified using a split Hopkinson pressure bar method. The following results are summarized. 1. The pressure sensitive film is able to respond to the impact pressure even for the duration of 200μs. 2. Even though sensitivity at impact loading is lower than that at static loading, relations between the depth of developed color and the impact load are uniquely determined for the respective kinds of films. 3. It should be noted that measurement of depth of color has to be done punctually after loading, since in some cases developed color is significantly changed and faded. (This is the translation of the paper entitled "Visualization of Impact Force by Using Pressure Sensitive Paper" written by the author in J.Soc.Mat.Sci.,Japan, Vol.47, No.1 , pp.20-25,Jan.1998 with permission of the Society of Material Science, Japan. )


