


Advanced Chlor-Alkali Technology
Jerzy Chlistunoff
Los Alamos National Laboratory
Executive Summary
The purpose of the project was continuation of the development of new chlor-alkali electrochemical reactors (ECRs) that employ oxygen-depolarized cathodes. Due to their lower operating voltages, the oxygen-depolarized reactors consume up to 30% less electrical energy per unit weight of the products (chlorine and caustic soda), than the state-of-the-art membrane electrolyzers with hydrogen-evolving cathodes.
The existing chlor-alkali membrane cells could not be simply retrofitted to accommodate the oxygen-depolarized electrodes due to the different principles and conditions of operation of the oxygen-depolarized cathodes and hydrogen-evolving cathodes. A completely new design of the oxygen-depolarized electrolyzer and optimization of the conditions of electrolysis were required in order to achieve satisfactory cell performance that would match or exceed that commonly attained in the state-of-the-art membrane cells with hydrogen-evolving cathodes. The zero-gap design of chlor-alkali cells developed at LANL was based on the fuel cells, where the cathode and the anode remain in intimate contact with the ion-exchange membrane.
Since the performance of any individual cell component can influence the performance of other components, the experimental effort focused not only on the oxygen cathode, but also on the anode, the membrane, the cell hardware, and the operating conditions. The vital performance characteristics which were monitored included the overall cell voltage, high frequency membrane resistance, caustic current efficiency, and composition of the caustic product. Our major accomplishments include:
- Elucidation of the mechanism of the unwanted peroxide generation
- Development of the method to eliminate peroxide
- Increasing the caustic current efficiency to match current industrial standards for membrane cells
- Elimination of the corrosion of the cathode hardware
- Evaluation of the ion exchange membranes
Although many problems associated with optimization of the technology were solved, some issues require additional work. Corrosion of the cathodes employing carbon supported platinum catalyst seems to be the major drawback of the current cell design. While the extent of corrosion can be significantly reduced by using cathode protection techniques, the technology would greatly benefit if the cathode was completely corrosion resistant. Consequently, any future effort should focus on developing the corrosion resistant cathode. Based on the current knowledge, the corrosion resistant cathode should involve a carbon supported metal catalyst, which would be less noble than platinum. Metal alloys or elemental silver are most promising choices for the catalyst. Another possible way to eliminate cathode corrosion may involve alternative supports for the catalyst. However, this path may be more effort intensive and less likely to produce the desired effect without creating other problems. On the contrary, all the technical improvements made so far are believed to be operational with the corrosion resistant cathode employing a carbon supported metal catalyst.
2. Introduction
Total US production of chlorine reached the level of 13.0 million tons in 2003, while the corresponding caustic soda production approached 14.7 million tons. Approximately 70% of chlorine and caustic produced in the US is manufactured by the diaphragm technology, 12% by the mercury technology and 18% by the modern membrane technology. The mercury process is the most energy intensive and consumes around 3700 kWh of electricity per metric ton of chlorine. The corresponding numbers for the diaphragm and membrane technologies are 2900 kWh/t and 2500 kWh/t, respectively. Overall, the chlor-alkali electrolysis is one of the most energy intensive industrial operations. It consumes approximately 10 GW (equivalent to 317 trillion BTU/yr or 87600 GWh/yr) of electrical energy, which corresponds to around 2% of the total electric power generated in the United States. Attempts to reduce manufacturing costs of chlorine have recently led to modifications of the conventional membrane electrolyzers that allow for operation at around 50% higher throughput (0.6 A/cm2) than the standard cells. While these modifications lower the capital and maintenance costs, they result in higher cell voltages and consequently in higher energy consumption. As the energy consumption per unit weight of the products is directly proportional to the electrochemical reactor cell voltage, lowering of the cell voltage is the only route to energy savings.
Over the last several years, membrane technology has been optimized to the extent that no viable reduction of the cell voltage is expected from further cell modifications. However, by replacing the hydrogen-evolving cathodes in the membrane chlor-alkali cells by oxygen-depolarized cathodes, the cell voltages and corresponding power consumption could be reduced by as much as 30% (Fig. 1).

Figure 1. 30% lowering in cell voltage and, hence, 30% lowering in energy consumption per unit weight of the products is achieved in chlor-alkali cells by replacing the hydrogen-evolving cathode by an oxygen-consuming cathode.
Figure 1 explains schematically the relationship between the ordinary membrane chlor-alkali ECRs (left) and the modified chlor-alkali ECR employing an oxygen cathode. Electric energy savings that could be achieved by implementing this modification in chlor-alkali ECRs are very significant. At a current density of 0.30 to 0.45 A/cm2, typically used by the industry, replacement of the hydrogen-evolving cathode by an oxygen-reducing cathode has been clearly shown by us to date to save around 1.0 V out of the 3.1 V to 3.3 V required for operation of conventional chlor-alkali ECRs. Since the electric power (energy) consumed per unit weight of product is directly proportional to the cell voltage, the reduction in the cell voltage at a constant current density amounts to savings of 30% in the electrolysis energy. The energy savings would be even more substantial if all the chlor-alkali plants switched to oxygen-fed membrane reactors. They can reach as much as 40%. Therefore, introduction of the energy saving, oxygen-depolarized reactors would amount up to a 0.8% cut in the overall US electric power consumption. It would also amount to a 0.8% cut in total US CO2 emissions associated with generation of electric power.
When the research described in this report was awarded funding, the hydrogen generated by the industry was quite commonly considered a low-value byproduct and many chlor-alkali plants were venting it to the atmosphere. Today, the Government recognizes hydrogen as a fuel of the future and funds the research aimed at both developing new technologies that would utilize hydrogen rather than the conventional fuels and finding efficient and safe ways of hydrogen storage. Quite recently, Dow Chemical installed the hydrogen/air fuel cell stacks supplied by General Motors to capture part of the energy stored in hydrogen generated by the Dows chlor-alkali plant in Freeport, Texas. While equipping the existing chlor-alkali plants with the hydrogen burning fuel cells seems feasible, it will never offer comparable energy and environmental benefits as the chlor-alkali technology utilizing oxygen-depolarized cathodes. First of all, the fuel cells can return only around 50% of the clean hydrogen energy, whereas much more of the dirty fossil fuel energy is consumed to generate the hydrogen. From the economic perspective, installation of the fuel cell stacks translates into yet another capital investment, in addition to the investment associated with constructing and equipping the chlor-alkali cell room.
Consequently, it is our belief that the economic and the energy/environmental factors are in favor of the technology that utilizes oxygen-depolarized cells and that this technology will eventually replace the current chlorine/caustic manufacturing methods.
3. Background
All three chlor-alkali technologies, which are currently in use, have advantages and disadvantages. The most frequently employed diaphragm technology uses very inexpensive cells, but it produces relatively dilute and impure NaOH. Consequently, significant use of steam is required to concentrate the hydroxide solution before it can be shipped to the point of use. Moreover, many diaphragm cells still utilize asbestos-based diaphragms, which raises environmental and health concerns.
The mercury technology produces highly concentrated, 50% hydroxide of the highest purity. In this case, no concentration steps are required. However, the electrolysis itself is very energy intensive. In addition, the mercury emissions from the process raise very serious environmental concerns. This method will soon be phased out.
The membrane technology produces high purity hydroxide and requires less steam to concentrate the NaOH solution than the diaphragm method. It is currently the cleanest and most energy efficient chlor-alkali technology. However, the membrane cells are relatively expensive, mainly due to the high cost of the specialized bi-layer ion exchange membranes that they employ. Nonetheless, this method completely dominates the chlor-alkali industry in Japan, where the energy prices are higher and the environmental regulations stricter than in the United States.
The attractiveness of the membrane technology with oxygen-depolarized cathodes versus the existing technologies relies on the substantial energy savings and the associated environmental benefits that this technology offers.
Despite how simple it sounds, replacement of the hydrogen-evolving cathode in a membrane cell requires significant changes in the cell design and materials as well as in the cell operating conditions. The key element of the oxygen-depolarized cell is the oxygen cathode of the gas diffusion type. The electrode has to be designed to facilitate formation of the three-phase boundaries (gas/liquid/solid) that involve oxygen, water/caustic soda solution, and the catalyst particles. Moreover, it has to effectively manage transport of oxygen to and caustic soda from the catalyst layer. Although gas diffusion electrodes (GDEs) have been quite extensively used in fuel cells and optimized for this application, the conditions encountered in the cathode compartment of a chlor-alkali electrolyzer are quite different. High viscosity of the concentrated NaOH and its strongly corrosive properties may have a negative influence on both formation of the three-phase boundaries in the electrode pores and transport of the reagents and products to and from the reaction site. In the worst case scenario, the electrode pores may get completely flooded with the NaOH solution and the cathode, where the hydrogen evolution takes place, will operate at much lower potential.
The presence of oxygen and significantly higher potential of the oxygen-depolarized cathode as compared to the hydrogen-evolving cathode can result in corrosion of the cathode hardware and other components in the cathode compartment, which would not be observed in the standard membrane cell thanks to the cathodic protection and reducing properties of hydrogen.
Another difference of practical importance between the hydrogen-evolving cells and oxygen-depolarized cells is the relative stability of the intermediate products of the hydrogen evolution reaction (HER) and the oxygen reduction reaction (ORR). The HER does not generate any stable intermediates:

Precipitation of sodium peroxide (eq. 4) can cause liquid and gas flow maintenance problems, block the electrode active surface area and even destroy the microporous structure of the gas diffusion electrode.
To our knowledge, there are no industrial-scale chlor-alkali plants equipped with oxygen-depolarized cells. However, there do exist pilot-scale plants in Japan and Europe that utilize oxygen-depolarized cells for the chlor-alkali electrolysis as well as for the similar process of HCl destruction. The technical details of these cells are not well known, but the finite-gap design seems to be the most prevalent. In cells of this type, the gas diffusion electrode acts as a separator of the oxygen and caustic chambers. The advantage of such a design is that the whole surface area of the ion-exchange membrane remains in contact with NaOH solution of the optimum concentration at all times, which guarantees the best overall membrane performance. However, the design also has serious drawbacks. The layer of NaOH between the electrode and the membrane contributes unfavorably to the overall cell resistance. In addition, as the hydrostatic pressure of the NaOH solution changes along the electrode height, maintaining the uniform distribution and identical properties of the three-phase boundaries and preventing the electrode flooding may pose problems.
In order to avoid the problems typical for the finite gap / three compartment electrolyzers, we have chosen the so-called zero-gap design, adapted from the fuel cell technology. In the zero-gap cell, the cathode remains in intimate contact with the ion-exchange membrane. Oxygen is fed to and caustic collected from the common cathode compartment. Different modifications of the zero-gap design, which were used throughout this research, are described in more detail in the technical part of the report. The project was a continuation of our earlier work on oxygen-depolarized chlor-alkali cells. It addressed the issues, which were previously identified as critical for making the oxygen-depolarized membrane cells match the current performance standards for the state-of-the-art hydrogen-evolving membrane cells. Among these issues were caustic purity, current efficiency, corrosion protection, etc.
The principal investigator is a member of the fuel cell team in Materials Science and Technology Division of the Los Alamos National Laboratory and together with Dr. Ludwig Lipp participated in the previous research on oxygen-depolarized chlor-alkali cells, which was directed by Dr. Shimshon Gottesfeld.
4. Technical Part
4.1 Critical Review of the Literature
The first attempts to develop chlor-alkali technology utilizing the air cathode date back to the early eighties. The laboratory scale cells developed by ELTECH Systems were operated for more than 350 days on scrubbed air at 0.3 A/cm2, but the test with commercial size cells was terminated after 105 days due to the durability problem of the air cathode [1,2]. Even though eventually abandoned, these early experiments demonstrated that significant energy savings can be achieved by replacing the hydrogen electrode in the membrane cell with an oxygen electrode. Research aimed at implementing the oxygen cathodes in chlor-alkali membrane cells has been especially intensive in the last 11-12 years and seems to be most advanced in Japan and Europe, where energy prices are higher and environmental policies stricter than in the United States. However, only a very limited amount of the published material covers the research done so far. One of the factors responsible for this situation is the proprietary nature of the results generated. Another factor results from the requirement of a stable cell performance for extended periods of time, comparable to that typical for the state-of-the-art membrane cells. While the long term cell performance may sometimes be predicted from the short time cell behavior, the only method that guarantees the correct determination of the performance durability is that based on operating the cell for as long as possible, which sometimes translates into running a single test for several months or even years. In order to achieve satisfactory cell performance, the oxygen diffusion cathode has to meet the following requirements:
- Efficient transport of oxygen and water to and NaOH from the reaction layer,
- Efficient catalysis of the oxygen reduction reaction according to eq. 2
- Efficient formation of the three phase boundaries involving oxygen, water (NaOH solution), and the catalyst
The transport of reagents to and products from the reaction layer is accomplished in two different ways. In the more frequently used, three-compartment or finite-gap cells [1-10], the oxygen cathode separates the cathode chamber into the oxygen and the NaOH compartments. The cathodes used in such cells are sometimes called gas-liquid-impermeable electrodes [11]. In a cell of this type, the gap between the electrode and the membrane is fed with a more dilute NaOH solution than the final product of the electrolysis. The feed mixes with the significantly more concentrated NaOH product. The concentration of the final NaOH product is maintained at around 32%, which guarantees the optimum membrane hydration and performance. In the zero-gap cells, the gas diffusion electrode remains in intimate contact with the ion exchange membrane. The oxygen and water enter the electrode from the gas diffusion layer side. Electrodes of this type are called gas-liquid-permeable electrodes and have been used by Permelec Electrode in Japan [11,12] and also at LANL
Both ways of transporting the reagents and products have advantages and disadvantages. The layer of NaOH solution between the electrode and the membrane in a three-compartment/finite-gap cell creates favorable conditions for optimum membrane performance, but it also contributes to the increased cell voltage. Moreover, it produces the height dependent differential pressure between the catholyte gap and oxygen across the cathode, which may lead to uneven gas/liquid separation inside the electrode, electrode flooding and caustic leakage into the oxygen/air compartment. Solving this problem requires a pressure compensation system, such as that based on oxygen supply via gas pockets [13-15]. The cathodes in zero-gap cells are less susceptible to flooding due to the lack of liquid volume between the electrode and the membrane, but maintaining the proper membrane hydration is more difficult than in the three-compartment/finite-gap cells due to the effects of the electrode and the membrane boundary layers [16].
While the variety of materials were studied as catalysts of the oxygen reduction in alkaline media [17-30], only carbon supported platinum (Pt/C) [3-5,9] and carbon supported silver (Ag/C) [4-9,11] have been used so far in either the laboratory-scale or pilot-scale chlor-alkali cells employing the oxygen cathodes. As expected, the platinum-based catalysts offer the highest rates of oxygen reduction. However, the electrocatalytic activity of silver is not negligible compared to that of platinum under the industrial conditions [31]. In fact, quite comparable cell voltages were observed for the cells loaded with 0.56 mg/cm2 of platinum and 2.63 mg/cm2 of silver by Furuya and Aikawa [5] and the performance of the Ag-loaded cells could possibly be improved if the catalyst particle size could be reduced [5]. Quite recently, mixed Pt/Ag catalysts have been studied and the catalyst containing 93% (atom) of silver was found to be as active as pure platinum [32]. Moreover, this catalyst did not deteriorate when the cell was shunted and the cathode compartment was not flushed with an inert gas. These conditions are known to cause significant losses of carbon supported Pt catalysts due to the direct dissolution of Pt and the oxidative corrosion of carbon carriers [3]. Both phenomena also occur during the cell operation, but their magnitude decreases significantly with the increase in current density [3].
Due to the strongly corrosive properties of the oxygen saturated, concentrated caustic, the chlor-alkali cells employing oxygen-depolarized cathodes are more susceptible to performance losses than the standard hydrogen-evolving cells. It was shown that prolonged cell operation lead to catalyst loss [3], changes in the cathode morphology [10,33], increased wetting of the gas diffusion layer [4] or even flooding of the cathode [9]. It was suggested [4,33] that one of the factors responsible for cathode degradation was generation of peroxide (eq. 3). However, no quantitative correlation between peroxide generation and performance losses was demonstrated.
4.2 Experimental
4.2.1 Cells
The cells used in this study employed either separate gas diffusion cathodes (Figs. 2 and 3) or so-called membrane-electrode assemblies (MEAs) (Fig.4).

Figure 2. Components of the oxygen-depolarized cell with the separate gas diffusion cathode and metal cathode hardware: 1 cathode current collector, 2 Teflon gasket, 3 cathode flow-field, 4 gas diffusion cathode, 5 hydrophilic spacer (if equipped), 6 ion exchange membrane, 7 - DSA® coated anode meshes, 8 Teflon gasket, 9 integrated DSA® coated anode flow-field/current collector.
The separate gas diffusion electrodes were either commercially available (ELAT® from E-TEK, Inc.) or homemade. The catalyst layer of the commercial electrodes contained either 80% or 20% of carbon-supported (Vulcan XC-72) platinum with a total Pt loading of 5.0 and 0.5 mg/cm2, respectively. The homemade electrodes also utilized a carbon-supported platinum catalyst (E-TEK). Unless otherwise stated, the geometric surface area of the electrodes was 50 cm2. The cathodes in some cells were separated from the membrane by a thin hydrophilic spacer (Panex® 30 carbon cloth, Zoltek) (Fig. 2).

Figure 3. Components of the oxygen-depolarized cell with the graphite cathode hardware: 1 integrated graphite cathode flow-field/current collector, 2 Teflon gasket, 3 gas diffusion electrode, 4 ion exchange membrane, 5 - DSA® coated anode meshes, 6 Teflon gasket, 7 integrated DSA® coated anode flow-field/current collector.
The membrane-electrode-assemblies (MEAs) were prepared using standard methods developed at Los Alamos National Laboratory. The cathode side of the bi-layer membrane was painted with a known amount of the solution containing unsupported precious metal catalyst, Nafion® binder solution, deionized water and isopropanol. Geometric surface area of the catalyst layer in the MEA was 50 cm2 and the catalyst loading was 5.0 mg/cm2. In order to ensure efficient transport of the reagents and products between the catalyst layer and the flow-field, the cells utilizing MEAs were equipped with separate gas diffusion layers that remained in intimate contact with the catalyst layer (Fig.4). The gas diffusion layers (GDLs) applied included the low temperature single-sided LT 1400-W and double-sided LT 2500-W from E-TEK as well as 60% teflonized Toray® paper.

Figure 4. Components of the oxygen-depolarized cell equipped with the membrane-electrode-assembly (MEA) type gas diffusion cathode: 1 cathode current collector, 2 Teflon gasket, 3 cathode flow-field, 4 gas diffusion layer, 5 membrane-electrode-assembly (MEA), 6 - DSA® coated anode meshes, 7 Teflon gasket, 8 integrated DSA® coated anode flow-field/current collector.
The LANL proprietary patterned metal flow-field was made of either stainless steel (SS316) or nickel. The stainless steel flow-field was gold-plated and the nickel flow-field was either gold- or silver-plated.
Unless otherwise stated, the anode consisted of DSA® coated titanium meshes (mesh 120 and 60). An integrated single serpentine channel anode flow-field and current collector were made of DSA® coated titanium. The cell gaskets were either custom manufactured TriguardTM gaskets (W.L.Gore, Inc.) or homemade using ~ 1 mm or ~1.6 mm Gore-Tex® Teflon tape (W.L.Gore, Inc.).
The cells were sandwiched between two metal endplates (not shown in Figures 2-4) of a larger size. The cathode endplate was made of stainless steel and the anode endplate was made of titanium. The endplates were designed to accommodate cartridge heaters and thermocouples for precise cell temperature control. Their relatively large size was essential for minimizing cell temperature fluctuations. The endplates also provided means for: (i) connecting the feed lines, exhaust lines (see section 4.2.2 and Figure 5) and power cables to the cell, and, (ii) fastening the cell elements and maintaining reproducible conditions at the membrane/electrode/flow-field boundaries. The last task was accomplished with the help of eight bolts, which were symmetrically placed near the edges of the endplates. The cell bolts were torqued to a preset torque that resulted in an average membrane compression of 689 kPa (100 psi), as determined in separate experiments with Pressurex® pressure sensitive film.
Five different membranes were used in the experiments. Four of them, hereafter called membrane 1, membrane 2, etc., were specialized chlor-alkali bi-layer membranes. The fifth one was BPSH-30, a homemade membrane originally designed for direct methanol fuel cells. The membranes used in the cells with separate gas diffusion cathodes (Figures 2 and 3) were soaked in either 2% NaOH solution (membrane 1) for an hour or dilute (pH=12) NaOH solution (membranes 2 through 4, and BPSH-30) for a few hours before use. As dry membranes (membranes 2 through 4) expanded from 8% to 10% upon the soaking, they were cut to size once fully swelled. Since membrane 1 was stored in hydrated state and it was precut before the soaking. All the membranes were kept wet during the installation. Unless otherwise stated, the results were obtained with membrane 1.
The MEAs were prepared using membrane 2 and installed in the cell without presoaking to prevent flaking off of the catalyst layer as a result of membrane expansion. Once the cell was assembled and placed in the test station, both the anode and cathode compartments were filled with a dilute NaOH solution (pH=12) and soaked for a few hours. The expansion of the MEA under such conditions was restricted by the GDL and the flow-field on the cathode side and by the titanium meshes on the anode side. When this procedure was applied, no delamination of the membrane and the catalyst layer occurred.
4.2.2. Experimental setup and conditions
Figure 5 below presents the schematic diagram of the reagent/product delivery/collection system for the two test stations used throughout the studies. The cells were operated at 90oC. Unless otherwise stated, the cathode chamber was fed with oxygen at 239 kPa (20 psig) at a flow rate corresponding to five times that required by stoichiometry of the four-electron oxygen reduction at the applied current density (eq. 2). The oxygen stream was humidified with 0.5 cm3/min of deionized water. The pressure in the cathode compartment was controlled by a backpressure regulator (Fig. 5), which was fed with nitrogen. The nitrogen feed line (not shown in Fig. 5) was equipped with a bleeding valve, which enabled simultaneous operation of two cells at different pressures.
The anode compartment was not pressurized. The used brine and chlorine from the anode chamber were separated in a recirculation tank (Fig. 5). The tank was equipped with an overflow and constantly fed with fresh purified brine (310 g/dm3, < 10 ppb Ca + Mg) supplied by either Dow Chemical (Freeport, TX) or Texas Brine Company (Sugarland, TX). Fresh and used brine were mixed thoroughly in the tank and part of the resulting solution was redirected to the cell while another part was collected for recycling. In this way, constant concentration of the feed solution was maintained. Unless otherwise stated, the feed concentration was 200 ± 3 g/dm3. The estimated outlet brine concentration was approximately 186 g/dm3 at 1.0 A/cm2 and proportionally higher at lower current densities. The chlorine gas was scrubbed with 18-20% NaOH solution.
The strongly corrosive environment in the cathode compartment may promote corrosion of the cathode and its hardware when the electrical circuit is open, especially as a result of a power outage during unattended cell operation. In order to minimize corrosion, the cathode gas feed line was equipped with two solenoid valves that would immediately stop the oxygen flow and replace it with nitrogen upon a power loss (Fig. 5). In order to prevent restoring of the oxygen flow upon the power return, when the electrolysis could not be automatically restarted, the valves were energized through an electric relay that required manual resetting after the power outage.
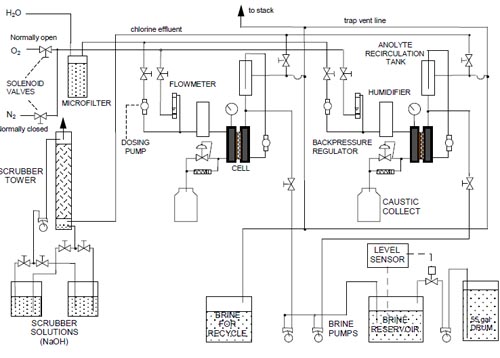
Figure 5. Diagram of the reagent/product delivery/collection system.
4.2.3. Analytical procedures
The peroxide content in the NaOH solution was determined spectrophotometrically. Fresh samples of sodium hydroxide were mixed with a known amount of potassium ferricyanide solution in aqueous NaOH. The peroxide content was determined from a decrease of ferricyanide absorption at 418 nm [34].
Caustic current efficiency was determined from titration of the sodium hydroxide samples with standardized 1.0 M HCl solution (Fisher) against phenolphthalein. Due to the very weakly acidic properties of hydrogen peroxide (pKa=11.75 [35]), the volume of the acid used to neutralize the NaOH sample corresponded to the sum of the sodium hydroxide present in the sample and the NaOH produced as a result of hydroperoxide anion (HO2-) protonation. Since the latter quantity was also equal to the amount of NaOH that would form as a result of HO2- decomposition, the current efficiencies quoted in the report are not corrected for peroxide.
4.2.4. Standard startup, shutdown, current ramping and cell protecting procedures
4.2.4.1. Startup procedure and current ramping procedure
Before installing the cell in the test station, the brine recirculation tank (Fig. 5) and the recirculation pump were flushed with DI water to remove any chlorine, hypochlorite and chlorate left in the anolyte feed system from the previous experiment. After the system was flushed, the recirculation tank was filled with a freshly prepared 200 g/dm3 brine. The cell was placed in the test station, the cartridge heaters and thermocouples were installed and the feed/exhaust lines were connected to the cell. Water and nitrogen were then fed to the cathode compartment and the fresh brine recirculated through the anode compartment of the cell. The cell and humidifier heaters were turned on. The cell temperature was increased in 10ºC increments. When the temperature of the cell reached 80ºC, the power to the solenoid valves was manually turned on, which caused oxygen to replace the nitrogen in the feed line. After that, a small protective current on the order of 1-2 A was immediately applied. The Labview® software was started and the current density was increased at the rate of 0.4 A cm-2 h-1 until it reached the desired value, most typically 0.2 A/cm2 (10 A for the standard 50 cm2 cell). While the cell current was being increased, the oxygen flow was adjusted to the desired level, the brine make-up pump started and the brine flow roughly adjusted to the level required by the target current density. The cathode compartment was pressurized either during the ramping or afterwards. The cathode pressurization was done in small increments by manually adjusting the pressure of nitrogen feeding the backpressure regulator. When the pressurization was complete the flow of water to the humidifier was adjusted to the desired level. The adjustment of the water flow could not be done before, as the gas pressure influenced the output from the humidifier pump (Fig. 5). By the time the above operations were completed, the cell temperature was already 90ºC. The brine concentration in the recirculation tank was then adjusted to the desired level. This was done by frequently measuring the brine concentration in the recirculation tank and adjusting the brine make-up pump speed accordingly, until the brine concentration stabilized at the desired level.
Ramping the current to a higher value was done in a similar way. As the cathode compartment was already pressurized, there was no need for readjusting the water flow as long as the intended oxygen humidification level remained unchanged. The startup procedure for the cells equipped with MEAs was preceded by soaking the MEA in dilute NaOH (pH=12) solution (see section 4.2.1).
4.2.4.2. Shutdown procedure
Shutting down the experiment started with turning off the cell heaters, reducing brine supply to the recirculation tank and applying the protective current of 1 2 A. When the cell temperature reached around 30 - 40ºC, the electrolysis was stopped, the oxygen and brine flows were stopped and the cell removed immediately from the station. Both the anode and the cathode compartments were flushed with DI water and the cell was immediately disassembled.
4.2.4.3. Temporary shutdown of the cell
In some cases, it was desirable to discontinue the experiment for a period of time and then restart it after the break. In such cases, the electrolysis was stopped, i.e., zero current was applied to the cell. Immediately after that, the oxygen flow was stopped and replaced by nitrogen flow by manually turning off the power to the solenoid valves. The cathode humidification rate was increased to wash out the remaining NaOH from the cathode compartment. The fresh brine supply to the recirculation tank was stopped. While the anolyte recirculation pump was still recirculating, most of the brine was drained and replaced with hot (~90ºC) DI water to maintain the cell temperature. This operation was repeated several times, until the stable open circuit voltage was measured. Then, the cell and humidifier heaters were turned off and the cell was left to cool down. When the cell temperature equilibrated, the nitrogen and water flows to the cathode compartment were stopped and the brine recirculation pump was turned off. The brine feed and chlorine/brine exhaust lines were disconnected from the cell and the anode compartment was completely filled with fresh DI water. The cathode compartment was depressurized and left filled with DI water and nitrogen.
4.2.5. Instrumentation
Constant current electrolysis was performed using a Lambda model LYS-K-5-0V or a PowerOne model SPM3A2K DC power supply coupled to a Hewlett Packard 6060B electronic load-box. The load-box was also coupled to a high frequency resistance measurement system that was comprised of a Voltech model TF200 frequency response analyzer and two Stanford Research Systems model SR560 low-noise preamplifiers for current and voltage signals. The system was controlled by Labview® software (National Instruments) installed on a MacIntosh computer. A cell voltage measurement was performed every six minutes and was immediately followed by a resistance measurement. In the latter case, a high frequency (2 kHz) ac signal of small amplitude (30 mV) modulated the voltage of the load-box and consequently the cell voltage and the current. The ratio of the ac components of the cell voltage and the current was assumed to be equal to the ion-exchange membrane resistance, hereafter called high frequency resistance (HFR). The error associated with this approximation was rather small, as the observed phase shift was typically in the range of 15-17o.
The system was also equipped with a Hewlett Packard model 3488A switch/control unit, a model 3421A data acquisition/control unit, as well as an IOTech model 488/4 serial bus converter. These were responsible for switching between the different modes of measurement, data acquisition from the two test stations, and data transfer to the computer.
4.3. Results
4.3.1. Cathode Modifications Aimed at Improving Caustic Current Efficiency
Standard hydrogen-evolving membrane cells are fed with 30% NaOH and generate 32% NaOH. This concentration range offers the best overall performance of the cell. However, one of the essential requirements of achieving the highest cell performance is the high rate of internal mixing in the cathode compartment, since non-uniform sodium hydroxide concentration may lead to performance deterioration. The hydrogen-evolving cathode consumes water and hence the sodium hydroxide concentration in its vicinity becomes higher than that in the bulk of NaOH. A similar boundary layer is also formed at the membrane surface, where the NaOH concentration is largely determined by the amount of water transported through the membrane. If the cathode and the membrane are very close to each other, both boundary layers may merge, and the cathode reaction may cause a further loss of water in the immediate vicinity of the membrane. Such an effect may lead to an increased membrane resistance and possibly even to membrane damage due to ohmic overheating of the carboxylic layer. Identical issues could also be expected for the oxygen-depolarized cells.
One may expect the cells employed in this study to be more susceptible to the undesired effects of the boundary layers due to their zero-gap design. However, the real situation is more complex. Unlike in the standard hydrogen-evolving cells, where the proper water balance in the vicinity of the membrane and the desired 32% concentration of the caustic product are maintained by simple means, i.e., by feeding the cell with approximately 30% NaOH, the cathode compartment of the cells used in this study was fed exclusively with oxygen and water. Moreover, the transport of water, caustic and oxygen, both within the cathode and between the cathode and the membrane, is governed by variety of driving forces, including capillary phenomena, pressure gradients, electric field gradients, etc. Consequently, predicting the actual NaOH concentration distribution may be more difficult.
In Figure 6, the cell voltages are plotted versus the current density for three experiments, where the cells equipped with the standard ELAT® electrodes (Fig. 3) were run at three different levels of oxygen humidification. The plots obtained for the dry oxygen and for the 0.5 cm3/min humidification exhibit some degree of non-linearity, which is frequently regarded as a sign of non-optimized membrane performance. The plot obtained for the saturated water vapor covers only a limited range of current densities and no conclusion regarding its linearity can be made. Since other factors, e.g., changes in transport of the reagents, may have also contributed to the observed phenomena, the effects of oxygen humidification were examined in more detail.

Figure 6. Cell voltages measured at low oxygen humidification levels. Red symbols no humidification. Black symbols oxygen with saturated water vapor. Four serpentine channel graphite cathode flow-field/current collector. Membrane 1.
Since the voltage vs. current density plot for the cell humidified with 0.5 cm3 of water per minute is convex, and the plot obtained for the dry oxygen is concave, we believe that different factors contributed to the non-linearity of the plots. For obvious reasons, the curvature of the plot obtained for the non-humidified cell (Fig. 6) is more likely to have originated from the interaction of the cathode and the membrane boundary layers, which resulted in too high catholyte concentration in the immediate vicinity of the membrane. Consequently, the water balance in the non-humidified cell was further explored. Figure 7 shows the concentration of the product NaOH, the molar ratio of water to sodium transported through the membrane, and the hypothetical NaOH concentration at the membrane surface, which would be observed if the cathode reaction did not consume water from the immediate vicinity of the membrane. Both, the hypothetical NaOH concentration and the water to sodium molar ratio were calculated from the product concentration by correcting it for the amount of water, which was consumed by the ORR.
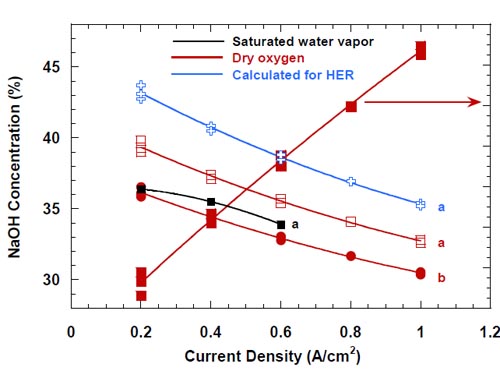
Figure 7. Concentrations of NaOH generated with and without oxygen humidification and the number of water molecules transferred through the membrane as a result of the electroosmotic drag. Four serpentine channel graphite cathode flow-field/current collector. Membrane 1. a final product concentration. b hypothetical NaOH concentration at the membrane surface (see text).
For comparison, concentration of the caustic product obtained from the electrolysis using the water vapor saturated oxygen and the calculated concentration of the NaOH product, which would be generated if the HER rather than ORR was the cathode reaction in the non-humidified cell, are also shown in Fig. 7.
When there is no external humidification, the only water available in the cathode compartment is that transported from the anode compartment through the membrane. This water is used inside the catalyst layer by the ORR, which concentrated the NaOH solution above the level resulting from the relative quantities of sodium and water transported through the membrane (Fig. 7). Since there is no source of water on the main escape route of caustic from the electrode through the gas diffusion layer towards the flow-field, we believe that the concentration of NaOH inside the electrode and in the thin boundary layer between the electrode and the membrane monotonically decreases from its highest value inside the electrode, which is equal to the final product concentration, to some value at the membrane surface, whose the lower limit is determined by the membrane transport properties (red curve marked with b in Fig. 7).
In accordance with the above analysis, the NaOH concentration next to the membrane, when no external humidification was applied, should lie between the two approximately parallel red lines in Fig. 7, which represent the final NaOH concentration and the hypothetical one, calculated as if the ORR consumed no water. The exact values of this concentration are unknown, but it seems that performance problems can be expected at low current densities (= 0.4 A/cm2), where the NaOH concentration in the membrane vicinity can reach the maximum value of 38 - 40 %. Consequently, the concave shape of the voltage vs. current density plot for the non-humidified cell in Fig. 6 results from the excessively high cell voltages at the low current densities rather than at high current densities (= 0.8 A/cm2), where the NaOH concentrations next to the membrane are lower due to increased water transport through the membrane (Fig. 7).
Figure 8 shows the high frequency resistance measured for the three levels of oxygen humidification. As clearly seen in Fig. 8, the high frequency resistance in the non-humidified cell (red curve in Fig. 8) at low current densities (= 0.4 A/cm2) is very high, which supports the hypothesis that the concave shape of the voltage versus current density plot for this cell (Fig. 6) reflects too high cell voltages originating from the boundary layer effects. On the other hand, the convex shape of the respective plot for the cell humidified with 0.5 cm3/min of liquid water pumped into the cell, most likely reflects partial flooding of the cathode with caustic solution at high current densities (= 0.8 A/cm2). A similar effect occurs to a lesser extent in the cell utilizing dry oxygen, because the volume of the NaOH solution generated under such conditions is smaller.
Figure 8 shows the high frequency resistance measured for the three levels of oxygen humidification. As clearly seen in Fig. 8, the high frequency resistance in the non-humidified cell (red curve in Fig. 8) at low current densities (= 0.4 A/cm2) is very high, which supports the hypothesis that the concave shape of the voltage versus current density plot for this cell (Fig. 6) reflects too high cell voltages originating from the boundary layer effects. On the other hand, the convex shape of the respective plot for the cell humidified with 0.5 cm3/min of liquid water pumped into the cell, most likely reflects partial flooding of the cathode with caustic solution at high current densities (= 0.8 A/cm2). A similar effect occurs to a lesser extent in the cell utilizing dry oxygen, because the volume of the NaOH solution generated under such conditions is smaller.
The apparent lack of performance issues at high current densities in the cell fed with dry oxygen suggests that the harmful effect of the increased water consumption by the ORR is more than compensated by the enhanced water transport through the membrane.

Figure 8. High frequency resistance at different oxygen humidification levels. Red line no humidification. Black line oxygen with saturated water vapor. Green line humidification 0.5 cm3/min. Four - serpentine channel graphite cathode flow-field/current collector. Membrane 1. Pt catalyst loading: 5.0 mg/cm2 - red line; 0.5 mg/cm2 green and black line.
This is one of the attractive features of the technology utilizing oxygen-depolarized cathodes, as compared to the conventional membrane technology. While the hydrogen evolution reaction (eq.1) in the standard membrane cell consumes one mole of water to produce one mole of NaOH, the oxygen reduction consumes two times less water (eq.2) and thus it is less likely to lead to significant dehydration of the boundary layer (see the lines marked with a in Fig. 7).
It has to be noted that the HFR measured at 1.0 A/cm2 is virtually identical for the cells fed with dry oxygen and humidified with 0.5 cm3/min of liquid water. Such a result suggests that the cathode/membrane boundary conditions must be very similar in both cases and the NaOH concentration in the solution between the membrane and the electrode is identical in both cells. Other important conclusions based on the plots in Fig. 8 are: (i) even the very low oxygen humidification, corresponding to the saturated vapor, significantly lowers the high frequency resistance and thus NaOH concentration in the membrane/electrode boundary layer at low and intermediate current densities (= 0.6 A/cm2), (ii) at 0.6 A/cm2, the saturated water vapor lowers the high frequency resistance as effectively as 0.5 cm3 of water per minute directly pumped into the cathode compartment.
In similarity to the high frequency resistance, the caustic current efficiency was found to be rather sensitive to the oxygen humidification. However, there was no straightforward correlation between the current efficiency and the level of humidification. The highest current efficiencies were observed for the cell fed with water vapor saturated oxygen, the lowest current efficiencies were observed for the cell humidified with 0.5 cm3/min of liquid water, whereas intermediate values were obtained for the cell fed with dry oxygen. Moreover, the level of humidification had a profound effect on the dependence of the CCE on current density. This is demonstrated in Fig. 9, where the CCE is plotted versus the current density for the three levels of humidification.
In order to explain the differences in the plots shown in Fig. 9, one has to consider a variety of factors that influence caustic current efficiency. Since there are no cathode side reactions which could lower the efficiency of NaOH generation, the only reason for lower than 100% current efficiency is the crossover of NaOH. This process can occur either by diffusion of the non-dissociated NaOH or by migration of hydroxyl anions through the membrane to the anode compartment. If there were no changes in membrane permeability associated with the changes in current density, both processes would exhibit a relatively simple dependence on the experimental conditions. The rate of diffusion would be independent of current density and proportional to the NaOH concentration at the membrane surface. The rate of migration of the hydroxyl ions would increase with the increase in NaOH concentration and with the increase in current density.
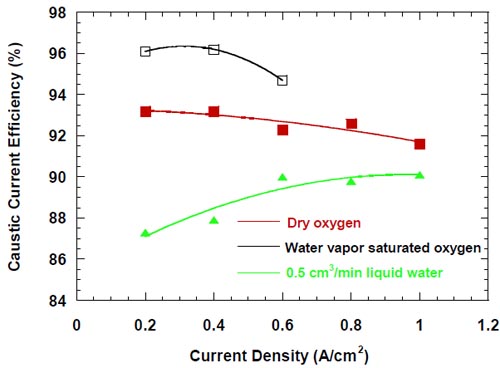
Figure 9. Caustic current efficiency at different oxygen humidification levels. Red line no humidification. Black line oxygen with saturated water vapor. Green line humidification 0.5 cm3/min. Four - serpentine channel graphite cathode flow-field/current collector. Membrane 1. Pt catalyst loading: 5.0 mg/cm2 - red line; 0.5 mg/cm2 green and black line.
However, the changes in current density produce changes in the physical properties of the membrane, which affect the membrane permeability and transport properties. Higher current densities promote more significant membrane swelling and increase its water content. As a result, the membrane becomes more open and the transport of water through the membrane becomes easier, as already demonstrated by the plot of the water to sodium ratio in Fig. 7. The more open structure also promotes transport of any other molecule or ion, including the undesired NaOH crossover. The membrane permeability is further increased by humidification, which lowers the NaOH concentration in the membrane vicinity. On the other hand, the lower NaOH concentration results in a lower driving force for NaOH transport through the membrane to the anode compartment. As a consequence, the CCE is a complex function of all the individual factors mentioned above. In accordance with this statement, we did not find any simple relationship between the CCE and any single parameter such as the HFR, current density (Fig. 9), or NaOH concentration.
The differences between the plots in Fig. 9 can be qualitatively explained as follows. In the cell where the dry oxygen was used, the NaOH concentration in the membrane vicinity at all current densities is the highest possible. The increase in current density significantly decreases the HFR (Fig. 8) and enhances permeability of the membrane (Fig. 7). Even though the concentration dependent driving force for the NaOH and OH- transport through the membrane decreases with the decrease in current density (Fig. 7), the increasingly open structure of the membrane and the increasing electric field in the membrane result in lowering of the CCE.
When the oxygen is saturated with water vapor, the concentration of the product NaOH is significantly lower than in the absence of humidification (Fig. 7). While the actual NaOH concentrations at the membrane surface are not known, they must be lower than in the cell without humidification (cf. also Fig. 8), which results in the lower driving force for the crossover. At the same time, the NaOH concentrations are not sufficiently low to cause significant changes in the membrane water content. The current efficiencies are higher than for the non-humidified cell.
The lowest current efficiencies were observed for the cell humidified with the 0.5 cm3/min of liquid water. In this case, the most important factor determining the CCE is the concentration of NaOH and its influence on the membrane permeability. Unlike in the two previous cases, the concentration of the NaOH product increases with the increase in current density (Fig. 10) due to the relatively large volume of water introduced to the cell, which is comparable with the volume of NaOH solution generated without humidification.

Figure 10. Caustic current efficiency at different oxygen humidification levels plotted versus concentration of the product NaOH. Red lines no humidification. Black line oxygen with saturated water vapor. Green line humidification 0.5 cm3/min. Four - serpentine channel graphite cathode flow-field/current collector. Membrane 1. Pt catalyst loading: 5.0 mg/cm2 - red line; 0.5 mg/cm2 green and black line. The arrows indicate current density increase.
As a consequence, the NaOH solutions generated at lower current densities are markedly diluted, which leads to the unusually significant membrane swelling (see also the HFR, Fig. 8) and the very enhanced NaOH crossover. The current efficiency is low and increases with the current density.In accordance with the above logic, the current efficiency for all levels of humidification seem to converge at high current densities, where the membrane is significantly swelled and the volume of water introduced to the cathode compartment is relatively small compared to the volume of caustic generated.
In previous work, we departed slightly from the zero-gap concept by introducing for the first time a hydrophilic spacer between the electrode and the membrane. The spacer was found helpful in maintaining stable caustic current efficiency at a level of a little below 90% at 1.0 A/cm2, reducing peroxide generation and lowering the cell voltage. As we suspected that the spacer could promote formation of the stagnant layer of concentrated caustic between the electrode and the membrane, we created a small opening in the upper part of the electrode and directed water from the humidifier to this opening to dilute and help remove the caustic from the spacer. After having realized that the boundary layer effects in our zero-gap cells may actually be weaker than initially suspected, we decided to modify the cell design and abandon the idea of direct humidification of the spacer. The modified cell allowed for no direct spacer humidification and resulted in a significant improvement of the caustic current efficiency at current densities not exceeding 0.6 A/cm2 (Fig.11).

Figure 11. Effect of direct humidification of the hydrophilic spacer on the caustic current efficiency. Platinum catalyst loading 0.5 mg/cm2. Humidification 0.5 cm3/min. Membrane 1. Panex® 30 carbon cloth spacer between the oxygen cathode and the membrane.
No clear effect of this modification on the current efficiency at high current densities (0.8-1.0 A/cm2) could be detected. However, the modification resulted in a small decrease in the cell voltage (Fig.12).

Figure 12. Effect of direct humidification of the hydrophilic spacer on the cell voltage. Platinum catalyst loading 0.5 mg/cm2. Humidification 0.5 cm3/min. Membrane 1. Panex® 30 carbon cloth spacer between the oxygen cathode and the membrane.
It was previously noted by us that uncontrolled discontinuation of the electrolysis resulting from a power outage or brownout frequently led to a decrease in the caustic current efficiency after the experiment was restarted. The most frequent scenario involved relatively short period of time, when no equipment was working, but the cathode compartment was flushed with oxygen or nitrogen, depending on whether the system was already equipped with the solenoid valves and the relay, which prevented the valves from reenergizing once the power was back (see part 4.2.2. and Fig. 5). This period of time was followed by a typically much longer period of time after the power was restored, when all the electrical equipment was working with exception of the Labview® computer software.

Figure 13. Effect of an uncontrolled interruption of the electrolysis on caustic current efficiency in the cell equipped with the integrated graphite cathode flow-field/current collector. The cell heated and flushed with oxygen during the interruption. Membrane 1.
Under such conditions (see conditions 1 and 2, Table 2), the cell was heated, the anode compartment was flushed with the brine from the anolyte recirculation tank (see Fig. 5) and the cathode compartment was flushed with water and nitrogen or, in many earlier experiments, with oxygen. The cell remained at its respective open circuit voltage, which was determined by the redox properties of the chemical species present in both the anode and the cathode compartment. After a sufficiently long time, the brine make-up pump eventually replaced the brine in the recirculation tank with the fresh brine, which did not contain oxidizers, e.g., chlorine, chlorine dioxide, hypochlorous acid and sodium chlorate, but it was significantly more concentrated (310 g/dm3). Also, a significant portion of the concentrated NaOH was washed out from the cathode compartment by the humidification water. Since the cathode hardware corrosion and the associated catalyst and membrane poisoning often accompanied this phenomenon, no unambiguous conclusion could be made as to the origin of the phenomenon and the ways of preventing or minimizing the decline in current efficiency. In one experiment, which was not influenced by the cathode hardware corrosion thanks to the use of the corrosion resistant graphite hardware, the current efficiency dropped from around 90% to around 86% as a result of an uncontrolled interruption of the electrolysis (Fig. 13). After approximately 20 hours, when the cell remained under the open circuit conditions, the electrolysis was restarted and the current efficiency relatively quickly returned to the level of approximately 90% (Fig. 13). Reversible character of the performance decline following an interruption of the electrolysis was also observed when the cell was equipped with the MEA-type cathode.
The undesired effects of power outages on caustic current efficiency seemed stronger and longer lasting in the cells equipped with the cathode spacers (Fig. 14), but one has to note the different conditions and history of the uncontrolled shutdowns as well as the different membranes used in the experiments shown in Figs. 13 and 14.
While there was no cathode hardware (flow-field and current collector) corrosion in the experiments shown in Figs. 13 and 14, the conditions in the cathode compartment during the break in electrolysis were rather corrosive due to the presence of oxygen (Fig. 13) and/or the other oxidizers, e.g., chlorates (Figs. 13 and 14), which diffused from the anode compartment through the membrane under the open circuit conditions. These oxidizers may have contributed to corrosion of the electrode and the membrane, catalyst loss and changes in electrode hydrophobicity, which may have influenced to some extent the current efficiency. Indeed, after the unexpected shutdown of the electrolysis, shown in Fig. 13, the cell started generating significant quantities of peroxide, which must have resulted from at least partial loss of the platinum catalyst.

Figure 14. Effect of an uncontrolled interruption of the electrolysis on caustic current efficiency in the cell equipped with the silver-plated nickel flow-field and Panex® 30 hydrophilic spacer. No spacer humidification. The cell heated and flushed with nitrogen during the interruption. Membrane 4.
Subsequent experiments demonstrated that the current efficiency also decreased when no oxidizers were present in the cathode compartment under the open circuit conditions (Fig. 15). Consequently, the decrease in current efficiency could only be associated with the presence of highly concentrated brine on the anode side of the membrane and caustic solution or water on the cathode side of the membrane.

Figure 15. Effect of a controlled interruption of the electrolysis on caustic current efficiency in a cell equipped with the silver-plated nickel flow-field and Panex® 30 hydrophilic spacer. No spacer humidification. The anode compartment flushed with deionized water and then with the fresh, concentrated brine. The concentrated brine recirculated through the anode compartment. The cell heated during the interruption. The cathode compartment flushed with nitrogen and DI water. Membrane 4.
Our first hypothesis was that the combination of water on the cathode side and concentrated brine on the anode side was more likely to cause problems than the combination of caustic solution and brine. The reasoning was based on the significant differences in the ionic strength in the first case, which could lead to an undesired strain in the membrane and potentially even cause damage to the membrane structure. While the hydrophilic spacer in the experiments shown in Figs. 14 and 15 was not humidified, we suspected that the humidification water, which was introduced into the cathode chamber, could have eventually washed out the caustic present in the spacer by entering the spacer from the bottom of the cathode compartment, where the water transitionally accumulated before the backpressure regulator (Fig. 5) allowed it to drain.

Figure 16. Effect of a controlled interruption of the electrolysis on caustic current efficiency in a cell equipped with the silver-plated nickel flow-field and Panex® 30 hydrophilic spacer. No spacer humidification. The anode compartment flushed with deionized water and then with the fresh, concentrated brine. The concentrated brine recirculated through the anode compartment. The cell heated during the interruption. The cathode compartment flushed with nitrogen and DI water. Membrane 1.
In order to prove this hypothesis, another cell design was implemented. In the modified cell, both the electrode and the spacer had smaller height than in the standard cell. They were placed in the upper part of the cathode compartment so that an empty space was created on the bottom of the cathode compartment, where water could accumulate. The bottom part of the membrane, which would be excluded from the current flow, was covered with a strip of a thick Teflon foil to minimize the unwanted crossover of NaCl from the anode compartment. The electrolysis was interrupted after more than 140 hours (more than 40 hours at 1.0 A/cm2), the solution in the anode compartment was replaced with the fresh brine and the cathode compartment was flushed with nitrogen and deionized water. After approximately 80 hours, the electrolysis was restarted and the current density ramped to 1.0 A/cm2. The current efficiency measured a short time after the restart was very low (~83%). The electrolysis was soon interrupted for more than an hour by the Labview software as a result of the oxygen shortage. Due to its short duration, the last interruption of the electrolysis is believed to have only a minor, if any, effect on the subsequent cell performance. The results of this test are shown in Fig. 16. As seen in Fig. 16, the controlled interruption of electrolysis had a profound effect on the current efficiency. The caustic current efficiency at 1.0 A/cm2 dropped from around 91% before the interruption to approximately 83% following the break in the electrolysis. During the next ~100 hours after the break, the current efficiency started increasing to eventually reach the level of around 85%. However, it started decreasing slightly during the subsequent 100 hours. The result of the above test is inconclusive. While any improvement in the membrane performance resulting from the cell modification would indicate that the significant difference in ionic strength on both sides of the membrane was responsible for the performance deterioration, the lack of improvement may result from variety of factors, also including inadequate masking of the part of the membrane which was excluded from the current flow. Consequently, the irreversible character of the performance deterioration in Fig. 16 does not imply irreversible damage to the membrane.
The origin of the performance losses caused by interruptions of the electrolysis is unclear. It is obvious that the prolonged presence of concentrated brine on the anode side and concentrated caustic or water on the cathode side contributes to the problem. While the reversible character of the current efficiency changes in the cells equipped with no spacer (see above) may suggest that the presence of concentrated caustic in the spacer is the major factor leading to performance losses following an interruption of the electrolysis, it has to be noted that the results presented in Fig. 13 may be influenced by other phenomena. In fact, the uncontrolled interruption of the electrolysis in this case resulted in a very significant increase in the peroxide generation rate, which corresponded to around 36% of the current being used for peroxide generation after approximately 350 hours of electrolysis (Fig. 13). Such a high peroxide generation rate led to a significant lowering of the NaOH concentration and thus possibly to a decrease of the NaOH crossover, which may have masked the current efficiency decrease resulting from the deterioration of the membrane performance.
The problem of caustic current efficiency decline following an interruption of the electrolysis requires additional studies.
4.3.2. Membrane Testing
The caustic current efficiency (CCE) and the ohmic drop in the cell are key characteristics determining performance of the membrane and its suitability for the chlor-alkali electrolysis. A perfect chlor-alkali membrane would have virtually no electrical resistance and guarantee almost 100% current efficiency. Unfortunately, the intrinsic membrane properties, which are responsible for its conductivity and selectivity, affect these parameters in a similar way, i.e., low membrane resistance is typically associated with low selectivity (current efficiency) and vice versa. However, thanks to the complex nature of the transport phenomena in the membrane, the relationship between both parameters is not straightforward and two different membranes can have identical conductivity and different selectivity under identical operating conditions. The chlor-alkali membranes which are currently in use are comprised of two layers of polymers that contain different acidic groups. The carboxylic layer on the cathode side of the membrane is more selective and less conductive than the sulfonic layer on the anode side. Properties of both ionomers and thickness of the layers determine the overall membrane performance. They are optimized to guarantee the highest possible current efficiency (current industrial standard for the membrane cell is ~96% at 0.4 A/cm2) and the lowest possible ohmic drop. Five different membranes were selected for testing. Membranes 1 through 4 were specialized chlor-alkali membranes. Two of them, membrane 3 and 4 had the gas release coating on the cathode side removed. The fifth membrane, BPSH-30, was homemade. It was originally designed for the direct methanol fuel cells to reduce methanol crossover. Its relatively low permeability was believed to promise high caustic current efficiencies.
Unfortunately, this material failed before starting the electrolysis, during the cell warm-up phase. Multiple micro cracks formed in the membrane, which eventually resulted in a brine leak from the anode to the cathode compartment. The remaining materials were tested under the standard conditions in the cells equipped with the commercial double-sided ELAT® electrodes containing 0.5 mg/cm2 Pt (see section 4.2.1.) and the hydrophilic spacer (Fig. 2). The spacer was not humidified (see section 4.3.1.). The standard anode structure was used in all the experiments.
The tests were run at five consecutive current densities: 0.2, 0.4, 0.6, 0.8 A/cm2, and 1.0 A/cm2 for approximately 24 hours at each current density below 1.0 A/cm2 and for at least 24 hours or more at 1.0 A/cm2. The current efficiencies were determined in the middle of each 24-hour period of time and the cell voltages were averaged over each 24-hour period.
Linear regression of the cell voltage versus the current density is commonly used to describe the membrane performance in a standard hydrogen-evolving cell. The slope of the voltage versus current density plot, or k-factor, is the membrane contribution. The intercept is the electrolyzer contribution. The lower the k-factor, the less resistive the membrane is. Table 1 shows the linear regression results of the data plotted in Fig. 17 together with the available literature data obtained from the tests using standard hydrogen-evolving cells.
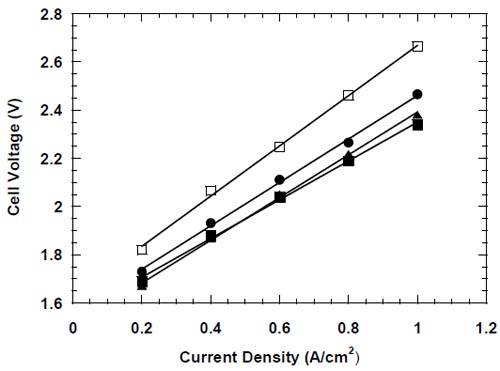
Figure 17. Measured cell voltages for different bi-layer membranes: membrane 1 full triangles, membrane 2 open squares, membrane 3 full squares, membrane 4 full circles.
Inspection of the data in Table 1 reveals significantly lower values of the k-factor in our cells as compared to the standard hydrogen-evolving cells. The origin of this difference is quite understandable. The markedly higher k-factors for the hydrogen-evolving cells reflect non-negligible contributions to the cell voltages from the resistance of the liquid NaOH and NaCl electrolytes in these cells. As such contribution was almost nonexistent in our zero-gap cells, one can estimate the electrolyte contribution to the measured k-factors for the standard membrane cells to be on the order of 33% and 31% for membrane 3 and membrane 4, respectively. The lower voltages of our cells that result from the different cathode reaction and their zero-gap design translate into significant energy savings. These savings are approximately 38% at 0.31 A/cm2.

Table 1. Linear regression results for the plots shown in Fig. 17.
Another important factor that determines the membrane performance is the caustic current efficiency. Figure 18 shows the measured caustic current efficiency plotted versus the current density. Two different membrane responses to the changes in current density can be observed. Membrane 4 and 3, both specifically designed for operations at higher than standard current densities, exhibit a gradual decline in the current efficiency with the increase in current density from 0.2 to 1.0 A/cm2. For the remaining two membranes, membrane 1 and 2, the current efficiency decreases with current density up to 0.8 A/cm2 and then increases at 1.0 A/cm2. The origin of the current efficiency minimum is not clear. However, it seems possible that it is related to the membrane response to changes in the anode boundary layer that result from the current density changes. As shown in section 4.3.5., a monotonic relationship between the current efficiency and the current density was observed for membrane 1, when one of the anode modifications was introduced.

Figure 18. Current efficiency for different bi-layer membranes: membrane 1 full triangles, membrane 2 open squares, membrane 3 full squares, membrane 4 full circles.
No clear correlation was found between the measured cell voltages and the caustic current efficiency, although higher cell voltages (high membrane resistances) were frequently associated with higher current efficiency and vice versa (Figs. 17 and 18). Membrane 4 provided the highest current efficiency in the whole range of current densities from 0.2 to 1.0 A/cm2 (Fig.18).
From an economic perspective, the most important parameter determining membrane quality is energy consumption per unit weight of the product. The energy consumption is proportional to the product of the cell voltage and the current (or current density) and inversely proportional to the caustic current efficiency. Consequently, in order to compare the energy efficiency for the membranes tested, it is convenient to introduce a new parameter: G = const*Energy = Voltage(V)*Current Density(A/cm2)/CCE(%)

Figure 19. Energy efficiency (see text) of different bi-layer membranes at low current densities: membrane 1 dotted green line, membrane 2 black line, membrane 3 red line, membrane 4 dashed blue line.
The parameter G reflects exclusively the amount of energy required to perform the electrolysis, whereas the total energy consumed by the chlor-alkali industry also includes the energy used to generate steam, which is used for concentrating the caustic soda to the level of 50%. Since the NaOH concentrations generated in the cells equipped with the different membranes under identical conditions were very similar and the average use of steam accounts for only around 16% of the total energy consumption by the chlor-alkali industry, we believe that equation 5 can be used with confidence for the analysis of the energy efficiency of cells equipped with the different membranes. The parameter G is plotted versus current density in Figures 19 and 20 for the lower (0.2 - 0.6 A/cm2) and higher (0.8 - 1.0 A/cm2) current density ranges, respectively.
As seen in Fig. 19, membrane 1, membrane 3, and membrane 4 offer very similar energy efficiency for current densities up to 0.6 A/cm2, whereas the use of membrane 2 is associated with significantly higher energy consumption.

Figure 20. Energy efficiency (see text) of different bi-layer membranes at high current densities: membrane 1 dotted green line, membrane 2 black line, membrane 3 red line, membrane 4 dashed blue line.
The performance of membrane 2 is even worse at the higher current densities (Fig.20). The demanding conditions of electrolysis at high current densities reveal differences in the performance of the remaining membranes too. While membranes 3 and 4 still offer the lowest energy consumption, the latter performing slightly worse at 1.0 A/cm2, performance of membrane 1 is noticeably poorer.
4.3.3. Cathodes Utilizing Unsupported Catalysts
As our earlier experiments indicated, carbon supported platinum catalysts had two disadvantages. Unexpected power outages, especially when oxygen was present in the cathode compartment, led to catalyst loss as a result of oxidation of the carbon support. Also, carbon particles are believed to contribute to the unwanted peroxide generation. Consequently, attempts were undertaken to develop electrodes which would utilize unsupported catalysts.
In accordance with our expectations, we found that the degree of utilization of an unsupported catalyst was generally lower than that of the same catalyst in the carbon supported form with the same nominal loading. A representative result is shown in Figure 21, where the voltages of the cells equipped with the cathodes containing supported and unsupported (HiSpec® 1000) platinum catalysts are plotted versus the electrolysis time.
In general, both the measured and the iR-corrected voltages of the cell equipped with the unsupported catalyst MEA were higher than those determined for the cell equipped with the standard ELAT. However, the differences between the measured (uncorrected) voltages were generally larger due to the higher HFR (not shown in Fig. 21) of the membrane used in the cell equipped with the unsupported catalyst MEA (membrane 2) as compared to that used in the cell equipped with the standard ELAT (membrane 1). The differences between the iR-corrected voltages (Fig. 21) reflect the differences in the activity and utilization of the catalyst in both cells. They are negligible at 0.2 A/cm2 and small at 0.4 A/cm2, but become significant at higher current densities, as reflected by the corrected voltages for the MEA cathode, higher from 100 mV to 200 mV than those determined for the ELAT cathode (Fig. 21).
The lower degree of utilization of the unsupported catalyst results from the smaller distances between catalyst particles and from possible particle agglomeration. As a result, a fraction of the catalyst surface area is completely inaccessible. Another fraction of the surface area, although in principle accessible, cannot be fully utilized since the closely neighboring particles compete with each other as reduction centers, which results in insufficient supply of the reactants to their surface. The effect is significant enough to overrule the favorable effect of the approximately two times higher specific surface area of the unsupported catalyst.

Figure 21. Measured and iR-corrected voltages for the cells equipped with the standard ELAT cathode and the hydrophilic spacer (black line) and the MEA-type cathode (red line). The catalyst content: ELAT 5.0 mg/cm2 carbon (Vulcan XC72) supported Pt, MEA 5.0 mg/cm2 unsupported Pt (HiSpec 1000). Membrane 1 (black line), membrane 2 (red line).
The catalytic activity/degree of utilization of the unsupported Pt catalyst decreased during the first 80 100 hours of the electrolysis, as manifested by the increase in the measured and the corrected cell voltages (Figs. 21 and 22), before it became stable. Since during this period of time, the standard experimental procedure of the stepwise ramping of the current was followed, it is unknown whether the current density, time or both were responsible for the effect. However, the most profound changes seemed to occur at 0.6 A/cm2 and 0.8 A/cm2, whereas the voltages were rather stable at 0.2 A/cm2 and 1.0 A/cm2.

Figure 22. iR-corrected voltages for the MEA-type cathodes (red line) containing 5.0 mg/cm2 of different catalysts. Membrane 2.
In principle, the increase in the corrected cell voltage can result from a decrease of accessible surface area of the catalyst or inhibition of the electrode process due to catalyst poisoning. Since a similar voltage increase was never observed in the case of carbon-supported platinum (Fig. 21), the decrease of the accessible surface area of the catalyst seems to be a more likely origin of the observed phenomenon. Two different phenomena may have contributed to this decrease, namely: catalyst particle agglomeration and disintegration of the catalyst layer. On the other hand, partial delamination of the membrane and the catalyst layer could not be responsible for the observed voltage increase, because such a phenomenon would be accompanied by an increase in the HFR, whereas no such increase was observed (Fig. 23).
Figure 23. High frequency resistance of the MEA containing 5.0 mg/cm2 Pt (HiSpec 1000). Membrane 2.
One has to note that no similar phenomenon was observed in the case of ruthenium-containing catalysts. As shown below, these catalysts undergo corrosion under the experimental conditions due to the surface oxidation of ruthenium, which eventually leads to formation of soluble ruthenates. Dissolution of the outermost catalyst layer exposes underlying layers and most likely also prevents particle agglomeration. As a consequence, no change in the net accessible surface area may be observed. We believe that catalyst corrosion must be accompanied by some disintegration of the catalyst layer. Since this phenomenon does not seem to induce an increase in the ohmic drop corrected voltages for the ruthenium-based catalysts (Fig. 22), disintegration of the catalyst layer containing pure Pt catalyst does not seem to be a very likely cause of the increase in the cell voltage. Consequently, particle agglomeration is the most likely cause of the performance losses of the MEA containing pure Pt catalyst.
In the case of platinum-ruthenium catalyst, the dissolution of ruthenium may result in formation of smaller, platinum enriched particles, which can still retain the activity of the original particles. Such an explanation of the lack of effect of the ruthenium dissolution on the activity of the platinum-ruthenium catalyst remains in accordance with the higher catalytic activity of platinum for the oxygen reduction.
As mentioned above, we found that ruthenium-based catalysts underwent significant corrosion during the electrolysis. The rate of dissolution of the mixed platinum-ruthenium catalyst was higher than that of pure ruthenium (Fig. 24.a). This effect could be associated with the smaller particle size of the Pt/Ru catalyst and thus the weaker bonding of Ru in the solid phase. While the concentration of the corrosion product, ruthenate, in the NaOH solution, strongly depended on the current density and thus the cell voltage (Fig. 24.b), the dissolution rate of ruthenium from the catalyst was relatively weakly dependent on the cell voltage and consequently on the cathode overpotential. Moreover, the dissolution rate did not decrease monotonically with the increase of cell voltage as would be expected, if the catalysts were undergoing a simple electrochemical oxidation. This indicates the complex character of the dissolution process and possible participation of chemical reactions that may be the rate determining steps of the overall reaction. The chemical steps most likely involve ruthenium oxides.
Figure 24.a. Dissolution rates of the ruthenium-containing catalysts plotted versus the cell voltage corrected for the ohmic losses.
Figure 24.b. UV-Vis spectra of the NaOH solutions generated at different current densities. The current densities in A/cm2 are listed at each spectrum.
Three different materials were tested as gas diffusion layers for the MEAs with unsupported catalysts. Figure 25 shows the unacceptable performance of the 60% teflonized Toray® paper used as the gas diffusion layer (GDL) together with the MEA containing 5.0 mg/cm2 of the pure Ru catalyst. Transport of the reagents and products through the paper was severely hindered, which resulted in unacceptably high cell voltages and the hydrogen evolution even at the lowest current densities. As the hydrogen generation posed a serious safety hazard, the experiments with the Toray® paper were eventually abandoned. Both the purity of sodium hydroxide generated and the appearance of the catalyst layer after the experiment implied no catalyst corrosion during the experiment. In fact, the lack of catalyst corrosion and the hydrogen evolution during the electrolysis strongly indicated that the cathode reaction was occurring exclusively on the surface of the paper rather than in the catalyst layer of the MEA.
Figure 26 shows the measured (as well as corrected for the ohmic drop) voltages for two cells equipped with the MEAs containing 5.0 mg/cm2 Pt (HiSpec® 1000) and two different, low temperature, gas diffusion layers, LT 1400-W ELAT (single-sided) and LT 2500-W ELAT (double-sided). As seen in Fig. 26, the double-sided gas diffusion layer performed significantly better, as reflected by the significantly lower cell voltages (around 200 mV at 1.0 A/cm2). The higher voltages observed for the single-sided gas diffusion layer are believed to result from its higher flooding susceptibility.

Figure 25. Comparison of 60% teflonized Toray® paper and LT 1400-W gas diffusion layers in the cells equipped with the MEAs containing 5.0 mg/cm2 Ru catalyst.
The oscillations of the ohmic drop corrected voltages of the cell employing the single-sided GDL (Fig. 26) can also be attributed to periodic changes in the degree of flooding of the GDL.
Unlike the standard ELATs with carbon supported platinum catalyst, the MEAs utilizing unsupported platinum were found to be resistant to corrosion during uncontrolled interruptions of electrolysis. As demonstrated in Fig. 27, after an 8 hour long interruption of the electrolysis, the cell equipped with the MEA was operated for more than 200 hours without any performance loss. However, a several days long interruption of the electrolysis under conditions used routinely to prevent catalyst loss from the electrodes utilizing carbon supported platinum (see Table 2, condition 4), led to irreversible loss of performance.

Figure 26. Comparison of performance of single-sided and double-sided gas diffusion layers applied in the cells equipped with the MEAs containing 5.0 mg/cm2s Pt catalyst (HiSpec® 1000).
When the electrolysis was restarted and the current density brought back to 1.0 A/cm2, the measured voltages were unacceptably high and shortly thereafter the cell had to be shut down. The post mortem examination of the MEA revealed significant delamination of the catalyst layer and the membrane. The increased and uneven swelling of the membrane and the Nafion binder is suspected to be a major factor responsible for the delamination.

Figure 27. Effect of controlled and uncontrolled interruption of the electrolysis on performance of the cell equipped with the MEA-type cathode. The arrows indicate voltages measured at identical current densities before and after the electrolysis interruption. Membrane 2. Platinum catalyst (HiSpec 1000) loading 5.0 mg/cm2.
Caustic current efficiency in the cells equipped with the MEA-type cathodes was similar to that in the cells equipped with the hydrophilic spacer, which was not humidified (Fig. 28). The largest difference between the current efficiencies (>2%) obtained for these two types of cells was observed at 0.2 A/cm2. The lower current efficiency in the cell equipped with the MEA may originate from the potentially easier access of water to the membrane in this case.

Figure 28. Comparison of caustic current efficiency of the cells equipped with MEA and with separate gas diffusion electrode. Catalyst: 5.0 mg/cm2 Pt. Membrane 2. MEA-type cathode black symbols, separate gas diffusion electrode red symbols. Current efficiencies closed symbols. Current densities open symbols.
The water introduced to the cathode compartment of the cell equipped with the separate gas diffusion electrode and the spacer has to be transported through the hydrophobic gas diffusion layer of the electrode, then through the less but still hydrophobic catalyst layer and finally through the relatively thick spacer filled with the NaOH solution, before it can reach the membrane. On the other hand, in a cell equipped with the MEA, the only barrier in the way of water toward the membrane is the hydrophobic gas diffusion layer. Once the water reaches the hydrophilic binder in the catalyst layer, it can freely diffuse towards the membrane. The overall effect of easier water transport in this case is small and limited to the lowest current density, because the main source of water in the catalyst layer is the water vapor rather than liquid water, which constitutes the largest fraction of water from the humidifier (see also section 4.3.1.). The results shown in Fig. 28 demonstrate that deposition of the catalyst layer onto the membrane did not affect adversely the membrane permeability and selectivity at the higher current densities.
4.3.4. Corrosion of the Cathode Hardware
In order to minimize ohmic losses in the cell, cathode hardware parts, i.e., the flow-field and the current collector must be made of electrically conductive material. A limited number of conductive materials, predominantly noble metals and their alloys, can withstand the strongly corrosive environment in the cathode compartment (highly concentrated caustic soda, high temperature, oxygen, and sometimes peroxide). In addition, the electrical potential of the hardware parts during the electrolysis may adversely affect the corrosion resistance of these materials. For instance, a material, which is corrosion resistant at its open circuit potential due to the passivation of its surface by an oxide layer, may lose its passivity at the potential of electrolysis.
Some of our experiments with the fuel cell type cathode hardware involved the integrated cathode collector/flow-field made of graphite, which was both corrosion resistant and inexpensive. Unfortunately, peroxide generation in the cells equipped with the graphite parts was unacceptably high (see part 4.3.6.). Another drawback of the graphite hardware was its high porosity that led to caustic leakage through the current collector plate when the cathode compartment was pressurized. Moreover, even though the machining of the flow-field channels into the graphite current collector block was relatively easy thanks to the softness of this material, the cost of the machining was relatively high. Because of the above shortcomings, an effort was undertaken to replace the graphite hardware with the separate metal current collector and easily scalable, non-machined flow-field.
Relatively inexpensive metals/alloys were selected as the construction materials for the cathode hardware parts. These were stainless steel (SS 316) and nickel. Both metals exhibit satisfactory corrosion resistance in alkaline media at their respective open circuit potentials. The parts were electroplated with noble metals, including gold and silver. The cells were run under the typical experimental conditions (see part 4.2.) for at least ten consecutive days. Then, the electrolysis was discontinued using either the standard shutdown procedure (see section 4.2.4.2.) or the procedure corresponding to one of the possible equipment failure modes as specified in Table 2 below.
We found that the gold-plated nickel hardware was undergoing significant corrosion both during the electrolysis and under the open circuit conditions and the extent of corrosion seemed independent of the gold coating thickness ranging from 50 to 500 microinches. When the electrical circuit was open and all the conditions were identical with those used during the electrolysis, i.e., the cell was heated, the brine was recirculated and the cathode compartment was flushed with oxygen and water (condition 1 in Table 2), the extent of corrosion under the open circuit conditions was larger than during the electrolysis. However, corrosion also occurred under the open circuit conditions when the cell was not heated and the cathode compartment was flushed with nitrogen and water. While no tests were run for the gold plated nickel hardware under the set of conditions denoted by number 4 in Table 2, where all potential oxidizers were removed from both the cathode and the anode compartment, we believe that chloride oxidation products, e.g., hypochlorite and chlorate, which diffused from the anode compartment, were responsible for the corrosion of the cathode hardware under the open circuit conditions, when the cathode compartment was flushed with nitrogen and the brine was recirculated (condition 5).
Corrosion of the Au coated nickel hardware is believed to occur via the electrochemical mechanism. Tiny pinholes in the Au coating allow for formation of electrochemical microcells, where the exposed nickel surface acts as the anode and the gold surface as the cathode. Oxygen and/or the chloride oxidation products are reduced on the gold surface and nickel is oxidized.
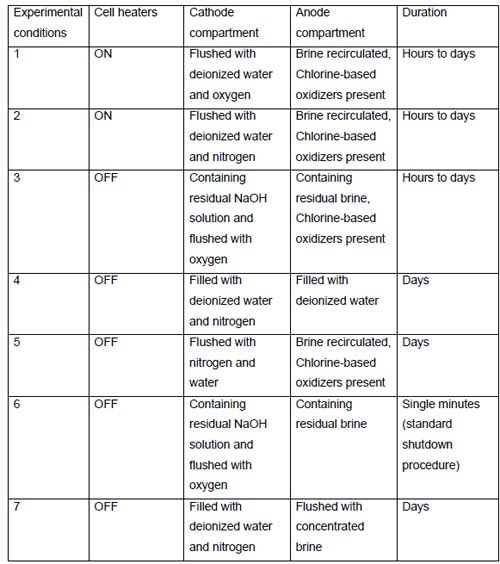
Table 2. The experimental conditions applied in the cathode hardware corrosion testing
Figure 29 below shows the extent of corrosion of the Au coated nickel current collectors resulting from an uncontrolled power outage (condition 3 in Table 2). Corrosion of the cathode hardware also occurred, when the cathode compartment was flushed with nitrogen and deionized water and brine containing chloride oxidation products was recirculated through the anode compartment. This result clearly demonstrates that the chloride oxidation products, e.g., hypochlorite, chlorate, chlorine, chlorine dioxide, etc., do participate in corrosion of the cathode hardware during uncontrolled interruptions of electrolysis.
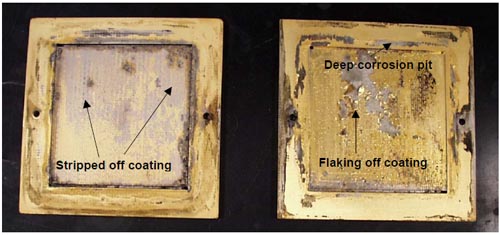
Figure 29. Corrosion of the gold plated nickel cathode current collectors resulting from a sixteen day power failure. Coating thickness: 1 µm (left) and 10 µm (right).
The gold-plated stainless steel (SS 316) hardware exhibited significantly better corrosion resistance than the nickel hardware, but corrosion still occurred both during electrolysis and under open circuit conditions. However, corrosion during electrolysis was almost negligible.
The silver-plated nickel hardware exhibited excellent corrosion resistance both during the electrolysis and under the open circuit conditions. No corrosion of the hardware could be detected for any condition listed in Table 2. While every experiment, where the gold plated cathode hardware was used, required a new flow-field and a new current collector, the silver-plated nickel parts could be reused several times, as there was no detectable signs of corrosion. The silver-plated cathode hardware parts were typically replaced after five to seven experimental runs, even though no corrosion was present. The reason for replacing the parts was gradual accumulation on the cathode side of the flow-field, of the black material from the cathode. The accumulation of this material resulted from repetitive and long lasting pressing of the flow-field against the cathode, which was necessary to create the good electrical contact between them. Although no measurable effect of this deposit on the cell performance was detected, occasional replacement of the cathode hardware was intended to avoid the potential effects of the deposit on the overall cell resistance.
A minor disadvantage of the silver-plated nickel hardware was that the flow-field and the current collector became virtually inseparable after a single experimental run. The origin of the effect is unknown, but electrochemically induced recrystallization of the silver coating seems most probable. Another effect that may have led to strong bonding between the hardware parts may involve formation of the shared silver oxide film on the surfaces of the current collector and the flow-field.
4.3.5. Anode Modifications
As the cathode and the cathode hardware modifications did not produce the desired increase in caustic current efficiency, different modifications of the anode were also tried. Several phenomena in the anode compartment may have a negative effect on the caustic current efficiency and other performance characteristics of the chlor-alkali cell. Large quantities of chlorine generated by the anode in close proximity of the membrane may lead to the so-called membrane blinding effect. The blinding effect is caused by chlorine bubbles, which partially block the membrane. The parts of the membrane that are covered with bubbles cannot participate in ion transport. As a result, the remaining parts may carry much higher current densities than those for which the membrane was designed and optimized. Since current efficiency tends to decrease with an increase in current density, the overall effect of gas blinding will be a decrease in the caustic current efficiency.
Caustic current efficiency can also be affected by other phenomena associated with the anode performance. As the chlorine evolution reaction consumes chloride anions, the concentration of sodium cations also drops in the immediate vicinity of the anode, because the solution has to remain electroneutral. As a consequence, the brine concentration near the anode decreases. When the region of lowered brine concentration reaches the membrane, more water is transported to the cathode compartment as a result of electroosmotic drag, which results in an increased swelling of the membrane and consequently in an increased caustic crossover and lowered caustic current efficiency. The brine depletion can also cause increased oxygen evolution on the anode. This reaction lowers chlorine current efficiency and generates hydronium cations. The increased generation of hydronium cations may result in an increase of membrane resistance as a result of protonation of the carboxylic layer of the membrane. Detrimental effects of oxygen evolution on caustic current efficiency can also be expected as a result of the increased transport of the hydronium cations through the membrane.
We have designed and tested four different anode modifications aimed at increasing caustic current efficiency. In our standard cells, the anode meshes are pressed against the membrane and undesired effects resulting from both the gas blinding effect and the brine depletion may be expected. We expected both effects could be alleviated by slightly moving the anode reaction zone away from the membrane. Consequently, the first modification considered was application of a suitable spacer between the membrane and the anode. Unfortunately, hot and wet chlorine is an extremely corrosive agent and not many materials are expected to be compatible with it. As our all-glass anolyte recirculation tanks containing hot brine and chlorine exhibited no signs of corrosion after having worked for tens of thousands of hours, we selected glass as the material for the spacer. The first modified anode structure contained a relatively loose glass fiber woven cloth as a spacer separating the anode and the membrane. Unfortunately, quite contrarily to our expectations, the caustic current efficiency for the modified cell was significantly lower than for the unmodified cell (see Table 3). In addition, the modification caused a significant increase of the cell voltage and erratic voltage-time behavior, as shown in Fig. 30. During the experiment, brine in the recirculation tank was slightly turbid and foaming. In addition, its acidity was very significantly increased, as may be expected for significant contribution of the oxygen evolution in the overall anode reaction. When the experiment was discontinued after merely 60 hours and the cell was disassembled, we found that the glass cloth was almost completely disintegrated. The corrosion of the cloth is deemed responsible for the brine turbidity and foaming in the recirculation tank. While it is difficult to present the detailed mechanism of the glass fiber corrosion, the following two reactions seem most likely:
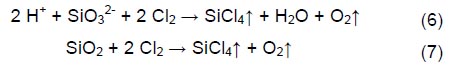

Figure 30. Significant increase of the cell voltage upon anode structure modification resulting from the use of the glass fiber cloth as a spacer between the anode and the membrane. Platinum catalyst loading 0.5 mg/cm2. Temperature: 90oC. Brine concentration: 200 g/L. Oxygen pressure 20 psig. Humidification 0.5 cm3/min. Membrane 1. Panex® 30 carbon cloth spacer between the oxygen cathode and the membrane.
The above reactions may not occur with bulk glass, but they are more likely to occur with the glass fiber cloth, where the surface area to volume ratio is significantly higher.
As seen from equations 6 and 7, corrosion of the glass fibers cannot be responsible for the increased brine acidity in this experiment. In fact, reaction 6 can actually lead to the opposite effect. As initially suspected, the reason for the increased brine acidity is most likely the oxygen evolution process: 2 H2O --> O2 + 4 H+ + 4 e-
We suspect that the circulation of brine in the glass fiber cloth was insufficient to maintain the desired brine concentration in the immediate vicinity of the anode surface. The brine concentration inside the spacer became quite low, which resulted in more significant oxygen evolution and brine acidification. The hydronium cations started being transported through the membrane and protonated its carboxylic layer, which led to a significant increase in the membrane resistance and thus also in the cell voltage (Fig. 30). When the glass fiber cloth started disintegrating (eqs. 6 and 7), the brine in the immediate vicinity of the membrane and the electrode could be more easily replaced with the fresh brine from the recirculation tank and when the corrosion progressed, the cell started returning to more or less normal operation, as manifested by the gradual voltage decrease at 0.4 A/cm2 (Fig. 30).
Three more anode modifications, hereafter called structures 3 through 5 were studied. While all of them were based on a similar principle, they produced different results. The modified structure 3 did not produce the desired increase in caustic current efficiency. Up to the current density of 0.6 A/cm2, the cell equipped with structure 3 generated sodium hydroxide with an efficiency that was almost identical to that obtained for the reference structure (structure 1). At higher current densities, the current efficiency of the cell equipped with structure 3 fell below that for the reference structure (Fig. 31). The structure 4 offered significant improvement over the reference structure at all current densities (Fig. 31). Structure 4 was the only anode modification that resulted in caustic current efficiencies matching the current industrial standards for the membrane cells operating at standard current densities (Fig. 31). Structure 5 did not improve the caustic current efficiency at low current densities (≥0.4 A/cm2) and performed similarly to the reference structure and structure 3. However, it performed as well as structure 4 at high current densities (≥0.6 A/cm2).

Figure 31. Effect of modification of the anode structure on caustic current efficiency. Platinum catalyst loading 0.5 mg/cm2. Temperature: 90oC. Brine concentration: 200 g/L. Oxygen pressure 20 psig. Humidification 0.5 cm3/min. Membrane 1. Panex® 30 carbon cloth spacer between the oxygen cathode and the membrane.
The changes in caustic current efficiency were not the only effects of the anode modifications. The cell voltage, another important performance characteristic, was also affected. Figure 32 shows the cell voltages for different anode structures, measured at five different current densities during the first 120 hours of the electrolysis. As seen from Fig. 32, all the anode modifications led to some increase in the cell voltage. There was no straightforward relationship between the measured cell voltages and the caustic current efficiency. For instance, the highest voltages were typically observed for structure 3, which did not improve the current efficiency, whereas the second highest voltages were observed for structure 4, which offered the largest improvement in caustic current efficiency (Fig. 31).

Figure 32. Effects of different anode structure modifications on the measured cell voltages during the first 120 hours of the cell operation. Platinum catalyst loading 0.5 mg/cm2. Temperature: 90oC. Brine concentration: 200 g/L. Oxygen pressure 20 psig. Humidification 0.5 cm3/min. Membrane 1. Panex® 30 carbon cloth spacer between the oxygen cathode and the membrane. The voltage increase for the structure 3 after ~110 hours resulted from an uncontrolled change in brine concentration.
In order to assess feasibility of the anode modifications, we used the method applied previously when testing different membranes, which is based on the changes in the energy efficiency of the electrolysis (eq. 5). The results are presented in Figure 33.

Figure 33. Energy efficiency (see eq. 5) of the cells equipped with different anode structures (see text) plotted versus current density.
It is clearly seen from Fig. 33 that structure 5 offers the lowest energy consumption per unit weight of the product at high current densities (0.6-1.0 A/cm2), and thattructure 4 is the second best, whereas structure 3 is worse than the reference. Due to their smaller absolute values, the differences in energy efficiency at low current densities are not seen well in Fig. 33. The relevant data are listed in Table 3. At the low current densities (0.2-0.4 A/cm2), the reference structure offers the lowest and the unworkable structure 2, the highest energy consumption. The energy efficiency of the cells equipped with the remaining structures does not follow exactly the same trend at 0.2 A/cm2 and 0.4 A/cm2 (Table 3), but the difference may result from experimental error.

Table 3. Performance characteristics of the cells equipped with different anode structures*
4.3.6. Effects of Different Factors on Peroxide Generation Rate
The peroxide content in the sodium hydroxide generated was found to increase with current density at both high (80% Pt, 5.0 mg/cm2) and low (20% Pt, 0.5 mg/cm2) catalyst loading (Fig. 34). This effect is believed to originate from the different kinetics of complete 4-electron reduction and partial 2-electron reduction of oxygen (eqs 2 and 3, section 3). The increase in current density shifts the cathode potential towards more negative values and affects the relative rates of peroxide and caustic generation.
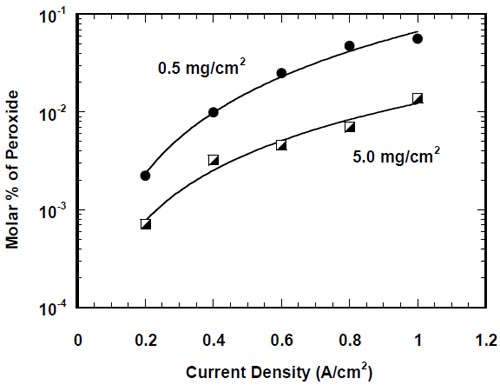
Fig. 34. Effect of current density and Pt loading on peroxide generation.
The ratio of peroxide concentrations generated at high and low catalyst loadings is roughly independent of current density and its average value for the plots in Fig.34 equals 4.5. The ratio of peroxide generation rates qualitatively correlates with the relative contents of Pt in catalytic layers of both electrodes and suggests that carbon and platinum particles compete as oxygen reduction centers. While the numbers of electrons involved in the ORR on the individual Pt and C particles and the respective efficiencies of peroxide generation are unknown, the literature data clearly demonstrate that gas diffusion electrodes containing pure carbon in the catalyst layer produce significantly more peroxide than electrodes containing carbon supported Pt catalysts [26,27,32,33,36].
The slightly higher overpotentials of the oxygen cathodes with low Pt loadings may also contribute to higher peroxide generation rates at low Pt loadings. The magnitude of this effect is rather small, since the observed differences in ohmic drop-corrected voltages amount to 0.05-0.08 V at 10 kA/m2.
The rate of peroxide generation depends on the electrolysis time. Peroxide concentration changes occur in times of tens to hundreds of hours and depend on experimental conditions. The typical dependence of peroxide concentration on electrolysis time is shown in Fig. 35.

Fig. 35. Time effect on peroxide generation rate. Platinum loading: 0.5 mg/cm2. Current density: 10 kA/m2.
We believe that the observed increase of peroxide generation at constant current density reflects the increasing role of carbon particles in oxygen reduction. The contribution from the carbon centers is likely to increase with time in the presence of peroxide [4], oxygen, and hot and concentrated caustic. These harsh conditions can lead to surface oxidation of the carbon particles and an increase of their hydrophilicity. Another likely reason for the more significant contribution of carbon in the cathode process and more significant peroxide generation is a loss of platinum surface area due to the agglomeration of Pt particles [31] and/or the loss of Pt particles due to the oxidative corrosion of carbon carriers [3].
An increase in the hydrophilicity of the cathode was always observed when a long experiment (from a few hundred to 2000 hours) was performed. Before the experiment, the water contact angle on the catalyst side of the electrode was around 147° and around 170° on the gas diffusion layer side. After the electrolysis, the contact angle was always below ~120° on the catalyst side and below ~140° on the gas diffusion layer side, but the measurement was quite inaccurate and the angle varied over the electrode surface. In the areas where the flow-field and gas diffusion layer remained in direct contact, the gas diffusion layer exhibited exceptionally elevated hydrophilicity, which was easily detected, when the electrode was rinsed with deionized water. The water frequently adhered to the electrode in the areas of contact and formed a pattern that was reproducing the geometry of the flow-field.
The measurement of the contact angle on the catalyst side was distorted by other phenomena. The prolonged electrolysis invariably resulted in the adhesion of the catalyst layer and the carbon cloth spacer. When the parts were being separated, numerous carbon fibers were transferred to the catalyst layer and some material from the catalyst layer was transferred to the carbon cloth. While the presence of the material from the catalyst layer on the hydrophilic spacer could be frequently seen with the naked eye, the presence of the carbon fibers on the electrode surface was detected using a microscope. Even though the amount of material transferred from the catalyst layer to the spacer was rather small, no attempts were made to determine the quantity of platinum present in the catalyst layer after electrolysis, since such an experiment was not expected to help understanding the changes in peroxide generation rate at 10 kA/m2. In accordance with the data obtained by Morimoto et al. [3], our previous experiments, where the cells equipped with no spacer were used, frequently indicated some catalyst loss during electrolysis. However, since the experiments at current densities above 2-4 kA/m2 required conditioning of the membrane at lower current densities to prevent its possible damage at higher current densities, any platinum loss determined after electrolysis always reflected the sum of losses at all the current densities applied. Among them, the possible loss of platinum at 10 kA/m2 was expected to be negligible [3] and masked by significantly larger losses resulting from the cell operation at lower current densities [3] during the initial hours of electrolysis.
Examination of the electrode after electrolysis under the microscope revealed also numerous cracks in both the gas diffusion layer and the catalyst layer. The number of cracks per unit surface area seemed to be higher on the catalyst side of the electrode. An attempt was undertaken to determine, if peroxide was predominantly responsible for the loss of electrode hydrophobicity. Small pieces of ELAT® were placed in three beakers containing: deionized water, 31 % (weight) sodium hydroxide, and 31 % (weight) sodium hydroxide with as high as possible quantity of peroxide added. The temperature of the solutions was maintained at approximately 90ºC. Unfortunately, due to fast peroxide decomposition, the experiment required frequent additions of peroxide and for this reason it could not be continued beyond eight hours. After such a short time, none of the samples exhibited any meaningful change in the contact angle. We believe that the observed increase of peroxide generation at constant current density reflects the increasing role of carbon particles in oxygen reduction.
The effect of brine concentration on peroxide production was studied at a current density of 10 kA/m2 for times longer than 500 hours after a steady-state peroxide generation rate was reached (Fig. 35). Brine concentration was adjusted by modifying the fresh brine supply to the recirculation tank. It usually took around an hour for the brine concentration to reach its steady-state level. For the purposes of hydroxide and peroxide analysis, samples of the caustic were taken after an additional one half to one hour after the brine concentration stabilized.
Figure 36 shows the effect of brine concentration on the composition of the NaOH solution generated. An increase of brine concentration from 136 to 228 g/dm3 produces an increase in NaOH concentration from around 26.5% to a little more than 31%. The peroxide content in the solution increases even faster, as manifested by approximately 25% increase of the peroxide-to-hydroxide molar ratio. The effect of brine on peroxide generation most likely results from changes in water activity at the oxygen reduction site caused by the NaOH concentration changes.

Fig. 36. Effect of brine concentration on peroxide generation rate and NaOH concentration. Platinum loading: 0.5 mg/cm2. Current density: 1.0 A/cm2.
The effect of brine strength on NaOH concentration most likely results from changes in the membrane swelling. At lower brine concentrations, the membrane is more swelled and more permeable than at higher concentrations. As a consequence, more water is transported through the membrane [37] yielding lower caustic concentration. A more quantitative measure of the degree of membrane swelling and permeability is its resistance, which increases about 7% for the measured increase in brine concentration. As could be expected, the caustic current efficiency also increases with the brine concentration as a result of a decreased caustic crossover (Fig. 37).

Fig. 37. Effect of brine concentration on membrane resistance and caustic current efficiency. Platinum loading: 0.5 mg/cm2. Current density: 10 kA/m2.
One may also suspect partial oxygen evolution [38] on the DSA® anode to contribute to the above phenomena (Figures 36 and 37). This reaction produces hydronium cations and its relative contribution to the measured current increases with the decrease in brine concentration [38]. The increase in the brine acidity may produce an increased H3O+ flux across the membrane, which may result in a lower membrane resistance, lower current efficiency, and lower NaOH concentration. Such an explanation would be plausible for a sulfonated membrane, which behaves like a strong electrolyte in both the acid and the sodium salt form and its conductivity correlates with the molar conductivities of hydronium and sodium ions [39]. The picture seems more complex in the present case. As the carboxylic layer of the bi-layer membrane behaves like a weak electrolyte when in the protonated form, the net effect of the enhanced oxygen evolution and the increased brine acidity may be opposite to the effect observed. Consequently, the effect of brine concentration on the extent of membrane swelling offers a better explanation of the effects shown in Figures 36 and 37.
The significant change in oxygen humidification level from 0 to almost 6 cm3/min decreases the peroxide-to-hydroxide molar ratio by approximately 10%. At the same time, caustic concentration drops from 31.6% to 12.6%, i.e., much more than observed in the experiments where the brine concentration effects were studied (see above).

Fig. 38. Comparison of effects of oxygen stream humidification and brine concentration on peroxide generation rate. Platinum loading: 0.5 mg/cm2. Current density: 10 kA/m2.
Quantitative comparison of the humidification and brine concentration effects on peroxide formation is shown in Fig. 38. Here, the molar ratio of peroxide-to-hydroxide is plotted against NaOH concentration, which is a common measure of the quantity of water introduced into the cathode compartment either by transport from the anode compartment through the membrane or by direct humidification of the oxygen stream. The much weaker effect of the direct humidification of oxygen (Fig. 38) indicates that most of the humidification water does not reach the catalyst layer and thus affects neither the composition of the liquid phase at the reaction site nor the membrane permeability. The main effect of oxygen humidification is the diluting of the NaOH solution that already left the electrode.

Fig. 39. Changes of chloride and peroxide concentrations in caustic soda during the first 300 hours of cell operation at 1.0 A/cm2.
Figure 39 presents time dependencies for the concentrations of chloride and peroxide in the NaOH solution generated at 1.0 A/cm2 during the first 300 hours of cell operation. During this time the most significant changes in peroxide concentration occur (Fig. 35). At the same time, the chloride content does not vary, except for the first 20 hours at 1.0 A/cm2 (between 50 and 70 hours after the start of electrolysis), where the membrane may not have attained its steady state permeability. These results demonstrate the insignificance of the chloride effect on peroxide generation.
The hydrophilic spacer significantly reduces peroxide generation (Fig. 40).
Figure. 40. Effect of the hydrophilic spacer on peroxide generation rate. Gold-plated cathode hardware. Panex® 30 carbon cloth used as the hydrophilic spacer.
We believe that the presence of spacer reduces the likelihood of carbon particles participating in the oxygen reduction in two ways. First of all, since the spacer acts as an efficient drain for the NaOH solution [12], the quantity of NaOH remaining inside the electrode decreases and the corrosion of carbon particles is less likely to occur. Secondly, without the spacer, the catholyte can accumulate in the pores of the Pt catalyst-free gas diffusion layer, and the partial reduction of oxygen may occur on carbon particles inside the gas diffusion layer.
Hydrogen peroxide in alkaline medium (HO2-) is typically regarded as very unstable. Since the decomposition of peroxide is catalyzed by trace impurities, the fact that the peroxide generated in our cells survives in spite of the unfavorable conditions in the cathode compartment, i.e., the strongly alkaline environment and the high temperature, can be associated with the high purity of the NaOH solutions generated. However, a variety of solid surfaces or surface defects can act as peroxide decomposition centers. Consequently, an effect of the cathode hardware coating on the peroxide generation rate was also studied (Fig. 41).

Figure 41. Comparison of peroxide generation rates in cells equipped with gold- and silver-plated hardware. Peroxide concentrations expressed in millimoles of peroxide per kilogram of liquid caustic. Platinum catalyst loading 0.5 mg/cm2. Membrane 1. Panex® 30 carbon cloth spacer between the oxygen cathode and the membrane.
During electrolysis, the potential of the cathode hardware parts is determined by the kinetics of oxygen reduction on the gas diffusion electrode, which has much higher active surface area than the hardware parts. While this potential, together with intrinsic properties of the cathode hardware coating, determine the rate of electrochemical decomposition of peroxide on the surface of cathode hardware parts, the final peroxide concentration in the caustic stream is determined by the relative rates of peroxide generation by the oxygen diffusion cathode and its destruction by the coating of the hardware parts. As the rates of peroxide generation in the cells equipped with identical oxygen diffusion cathodes under identical experimental conditions are the same, differences in measured peroxide levels reflect relative ability of the different hardware coatings to decompose peroxide by-product. Figure 41 shows concentration of peroxide generated in two cells equipped with gold plated and silver plated hardware under comparable conditions.
At low current densities (0.2-0.4 A/cm2), the cell equipped with silver plated hardware was found to produce less peroxide byproduct. The opposite situation was true for high current densities (0.8-1.0 A/cm2), i.e., less peroxide was detected in the caustic product generated in the cell equipped with the gold plated hardware.
One of the expected benefits of using unsupported catalysts (section 4.3.3.) was elimination of the peroxide generation. The experiments revealed that removal of carbon support from the catalyst layer reduced the unwanted byproduct. However, no complete peroxide elimination was achieved, even when the most potent oxygen reduction catalyst, i.e., pure platinum was used. This finding implies that either the oxygen reduction on platinum does not occur completely according to the four-electron mechanism (eq. 2) under the experimental conditions applied or the carbon-containing gas diffusion layer contributes to the overall reduction current and is at least partially responsible for the peroxide generation. Simultaneous occurrence of both phenomena is also possible.
The results shown in Fig. 42 suggest that the gas diffusion layers in cells equipped with the MEA-type cathodes can participate in the oxygen reduction and be responsible for some peroxide generation. As demonstrated above (see section 4.3.3.), the single-sided gas diffusion layer is more likely to get partially flooded by NaOH solution. The partial flooding of the gas diffusion layer facilitates formation of the three-phase boundary involving the carbon particles in the gas diffusion layer, oxygen and NaOH solution and thus creates suitable conditions for participation of the gas diffusion layer in the overall reduction current. The lower rate of peroxide generation in the cell equipped with the more hydrophobic, double-sided GDL (Fig. 42) remains in accord with the above hypothesis.

Figure 42. Comparison of peroxide generation rates in cells equipped with MEAs containing 5.0 mg/cm2 of the Pt catalyst (HiSpec 1000) and different gas diffusion layers. Peroxide concentrations expressed in millimoles of peroxide per kilogram of liquid caustic. Red symbols double sided gas diffusion layer (LT-2500-W). Black symbols single sided gas diffusion layer (LT-1400-W). Solid symbols peroxide concentration. Open symbols current density. Membrane 2.
The MEA-type cathodes containing both the pure ruthenium and the mixed platinum/ruthenium catalyst produced significantly less peroxide than the pure platinum catalyst and the peroxide concentration decreased in the order: Pt > Ru > Pt/Ru. Consequently, the mixed Pt/Ru catalyst was found to be most efficient in destroying the unwanted byproduct. The highest peroxide concentration detected for a ruthenium-based catalyst was 0.12 mmol/kg at 1.0 A/cm2 after approximately 160 hours of electrolysis in the cell, where the pure ruthenium was used (see also Fig. 42).
The low concentrations of peroxide generated in the cells which utilized the ruthenium-based catalysts, most probably originates from catalytic action of ruthenates on the peroxide decomposition reaction, as confirmed by the results of simple test tube experiments. Moreover, the relative quantities of peroxide generated in the cells utilizing the Pt/Ru and Ru catalysts inversely correlated with the amounts of ruthenium present in the respective NaOH solutions (see Fig. 24).
In order to eliminate the peroxide from the product stream, the cathode design and structure were modified. The first modification, hereafter called the modified cathode structure 1, resulted in a very substantial decrease of the peroxide generation rate. The results obtained for the modified cathode are shown in Fig. 43 (above) together with the typical results obtained for the standard ELAT cathode equipped with the hydrophilic spacer. As easily seen, the modified structure 1 is especially efficient in destroying peroxide at high current densities, which are targeted by the new technology. While the rate of peroxide generation by all the cathodes studied previously significantly increased with current density, an opposite trend was observed for the modified structure (Fig. 43).

Fig. 43. Peroxide generation rates in the cells equipped with the modified cathode structure 1 (see text) and with standard ELAT cathode and hydrophilic spacer (Panex 30). Gold-plated cathode hardware. Catalyst: 5.0 mg/cm2 Pt. The even numbers denote current densities in A/cm2. Gold-plated cathode hardware used.
As opposed to all cathode structures studied previously, peroxide concentrations generated by the modified cathode structure were consistently low during long-term cell operation approaching 2 months (Fig. 44).

Figure 44. Effects of long time cell operation on peroxide generation rate in a cell equipped with the modified cathode structure 1 (see text).
The cell equipped with modified cathode structure 1 exhibited slightly higher voltages than the cell equipped with the standard ELAT cathode and no hydrophilic spacer. The cell voltage increase (Fig. 45) is considered a relatively small penalty for the negligible peroxide generation.

Figure 45. Effects of current density on cell voltages and high frequency resistance for the LANL standard cathode hardware and the modified structure 1. Even numbers in circles denote consecutive current densities in A/cm2. Temperature: 90oC. Brine concentration: 200 g/l. Standard LANL hardware: HFR (green), Voltage (black) . Modified structure 1 : HFR (red) , Voltage (blue) .
A series of experiments was performed to elucidate the effects of extreme conditions on the overall performance of structure 1. The experiments revealed that the new cathode was more susceptible to flooding than the cathode structures used previously. Figure 46 shows the changes in the observed cell voltage brought about by changes in the oxygen flow rate.

Figure 46. Effects of change of experimental conditions on performance of the cell equipped with the modified cathode structure 1. Red arrows indicate times when the oxygen flow rate was changed. The new flow rates are indicated by the numbers corresponding to how many times the oxygen flow rate exceeded that required by the stoichiometry of the complete oxygen reduction. Green arrow marks termination of the experiment. Temperature: 90oC. Brine concentration: 200 g/dm3. Current density: 1.0 A/cm2.
As shown in Fig. 46, a change in experimental conditions lead to the voltage instability and eventually to its significant increase. The voltage increase was found to be irreversible, since returning to the previous experimental conditions did not result in lowering of the cell voltage (Fig. 46). Some improvement was noted after temporarily discontinuing the electrolysis and flushing the system with pure water under nitrogen, but no complete recovery was observed. This behavior was quite consistent with the flooding phenomenon.
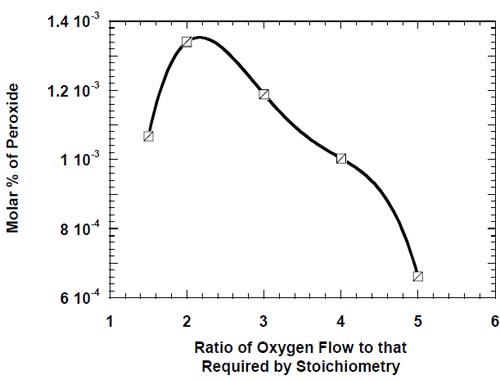
Figure 47. Dependence of peroxide generation rate on the oxygen flow rate for the modified cathode structure 1 (see text).
Fig. 47 demonstrates rather complex character of the effect of oxygen flow rate on peroxide generation. The presence of a maximum in the plot suggests opposite influence from at least two different factors. When the inlet oxygen flow rate becomes low, i.e., close to that required by the stoichiometry of 4-electron oxygen reduction (eq. 2), the outlet pressure in the cell drops below the preset value of 20 psig, as there is unsatisfactory supply of the gas to the cell. As a result of the pressure drop, the relative kinetics of the 4-electron and 2-electron oxygen reduction processes (eqs. 2 and 3) are likely to change, which can result in smaller quantities of peroxide generated. The decrease of the peroxide generation rate at significantly higher rates of oxygen flow most likely results from the effect of gas flow on the effectiveness of caustic removal from the electrode. High gas velocity in the cathode chamber makes the removal of caustic from the electrode pores easier.

Figure 48. Estimate of the limits of safe cell operation from hydrogen evolution in a deliberately flooded cell equipped with the modified cathode structure 1. Temperature: 90oC. Brine concentration: 200 g/dm3.
Shorter residence time of NaOH inside the electrode lowers the likelihood of carbon participating as the oxygen reduction catalyst and thus also the peroxide generation rate. Moreover, under such conditions, water from the humidifier has better access to the electrode pores, which may lead to a decrease of caustic concentration at the reaction site and an effect similar to the effect of brine concentration on peroxide generation may result.
Since electrode flooding reduces the number of catalyst particles available for oxygen reduction, flooded electrodes are likely to generate hydrogen, which can create rather dangerous conditions. In order to assess limits of safe electrolysis, one of the cells was deliberately flooded and hydrogen content in the exhaust oxygen stream was monitored at different current densities. Figure 48 (above) shows a plot of the hydrogen content versus the cell voltage corrected for the ohmic drop.
Linear extrapolation of the plot in Fig. 48 towards the low voltages gives an estimate of the corrected cell voltage, where virtually no hydrogen is produced.
The estimated value of the onset of hydrogen evolution (2.125 V) can be used to determine the highest operating current density for a cathode with the identical catalyzed layer as long as the cell voltage corrected for ohmic losses is known. The result of such a determination for the standard cell equipped with the hydrophilic spacer is shown in Fig. 49. Since the actual fraction of the current that produces hydrogen increases with the degree of flooding, the highest operational current density for the cell with no flooding can be even higher than ~2.7 A/cm2, the value obtained from the linear extrapolation of the plot shown in Fig. 49.

Figure 49. Determination of the highest operating current density from the onset of hydrogen evolution in a cell with the flooded cathode. Temperature: 90oC. Brine concentration: 200 g/dm3. Pt loading 5.0 mg/cm2. Panex 30 spacer.
Further modifications of the cathode structure were introduced to reduce its susceptibility to flooding and still maintain the low peroxide generation rates. The modification resulted in an improvement of the flooding characteristics. However, the performance of the modified structure, hereafter called modified structure 2, was found to deteriorate over time in terms of both peroxide generation rate (Fig. 50) and cell voltage stability.

Figure 50. Peroxide generation in a cell equipped with the modified cathode structure 2.
Most promising ways to improve the overall performance of modified structure 2 were determined and are planned to be implemented in the future.
Accomplishments
- Effects of Operating Conditions on Selected Performance Characteristics of Oxygen-Depolarized Chlor-Alkali Cell by L.Lipp, S.Gottesfeld, J.Chlistunoff, Centennial Meeting of the Electrochemical Society, Philadelphia, May 2002
- Zero-Gap Chlor-Alkali Cell With Oxygen-Consuming Cathode. Hardware Effects on the Cell Operation by Ludwig Lipp, Shimshon Gottesfeld and Jerzy Chlistunoff, 203rd Meeting of the Electrochemical Society, Paris, France
- Oxygen-cosuming chlor alkali cell configured to minimize peroxide formation by J.Chlistunoff, L.Lipp, S.Gottesfeld. Patent application 20050026005.
- L.Lipp, S.Gottesfeld, J.Chlistunoff, Peroxide Formation in a Zero-Gap Chlor-Alkali Cell with an Oxygen-Depolarized Cathode. Accepted for publication in the Journal of Applied Electrochemistry
- Oxygen-Depolarized Chlor-Alkali Cells. Some Consequences of Using Oxygen Diffusion Cathodes by J.Chlistunoff. Abstract of the presentation for the 206th Meeting of the Electrochemical Society.
- UV Spectroscopic Study of Ion Association of Hydroperoxide Anion HO2- in Concentrated Sodium Hydroxide Solutions by J.Chlistunoff and J-P.Simonin, paper in preparation
Conclusions and Recommendations
This study demonstrates that the zero-gap chlor-alkali cells with gas-diffusion cathodes offer a practical alternative to the standard membrane-cells. At the standard industrial current densities (≤ 0.4 A/cm2), the oxygen-depolarized cells produce caustic with current efficiencies matching current industrial norms for membrane cells but at significantly lower voltages and thus with substantial energy savings. The cells can also be operated at significantly higher current densities (up to 1.0 A/cm2).
The best overall cell performance was obtained when carbon supported platinum was used as the oxygen reduction catalyst. The shortcomings of carbon as the catalyst support include its insufficient corrosion resistance in oxygenated caustic and the involvement in peroxide generation. We demonstrated that peroxide generation can be virtually eliminated by proper cathode design. However, the poor corrosion resistance of carbon reduces the cathode durability. Cathode corrosion significantly decreases with the increase in current density and it is most likely negligible at 1.0 A/cm2, but operating the cell at lower current densities and (especially) unexpected power outages can lead to substantial losses of the precious metal catalyst.
The MEA-type electrodes utilizing unsupported catalysts offer excellent corrosion resistance during power outages. However, they operate at significantly higher voltages and consequently they reduce the energy savings. Moreover, they do not guarantee the elimination of peroxide as long as carbon-containing gas diffusion layers are used.
The catalyst loss under open circuit conditions can be avoided by automatically applying cathode-protecting conditions, e.g., flushing the cathode compartment with an inert gas, etc., but the same method cannot be applied when the cell is being operated.
Two ways of alleviating the problem seem most obvious. As the precious metal catalyst most likely participates in the oxidative corrosion of carbon carriers by forming local micro-cells involving carbon particles, using a less precious metal as the catalyst may be a feasible alternative. Although worse than that of platinum, the catalytic activity of silver is non-negligible under the industrial conditions and the corrosion resistance of cathodes utilizing carbon-supported silver was shown to be better than those utilizing the carbon-supported platinum. Metal alloys, such as for example Ag93Pt7 [32], are a promising alternative to the expensive platinum.
Another way of solving the cathode corrosion problem may involve alternative catalyst supports, which will exhibit better corrosion resistance in the oxygenated NaOH solution.
The more detailed summary of the most important technical results obtained is presented below:
- Zero-gap chlor-alkali cells with oxygen-depolarized cathodes offer very significant energy savings versus the conventional membrane cells equipped with hydrogen-evolving cathodes. The documented savings reach as much as 38% at 0.31 A/cm2.
- The zero-gap cells of our design with the modified anode structure generate caustic soda with current efficiency above 96% at standard industrial current densities (= 0.4 A/cm2). These current efficiencies match or exceed the current norms for conventional industrial membrane cells. At higher current densities (0.6 A/cm2 = j = 1.0 A/cm2), the current efficiency exceeds 90-94% depending on current density.
- Due to the smaller water consumption by the oxygen reduction process as compared to the hydrogen evolution reaction, oxygen-depolarized cathodes offer more favorable conditions for membrane operation and allow higher current density operation with a smaller risk of ohmic overheating of the membrane.
- The magnitude of the effects of oxygen humidification on the cell voltage and caustic current efficiency is predominantly determined by the relative amounts of water introduced to the cathode compartment with oxygen and through the membrane from the anode compartment, as well as by the cell design. The optimum level of humidification, which guarantees the best overall cell performance, depends on the cell design, the membrane used and the operating conditions, e.g., the current density.
- Of the chlor-alkali membranes tested, membrane 4 offers the highest energy efficiency at the highest current densities (0.8-1.0 A/cm2), membrane 3 is the second best, while membrane 1 performs noticeably poorer. At lower current densities (0.2-0.6 A/cm2), the performance of these three membranes is very comparable. The older chlor-alkali membrane (membrane 2), performs significantly worse than the remaining membranes at all current densities.
- The unwanted byproduct of the cathode reaction, peroxide, is predominantly formed as a result of the oxygen reduction on carbon particles present in both the catalyst and the gas diffusion layer of the standard ELAT® electrode. Consequently, peroxide is not eliminated in the cells equipped with the membrane-electrode-assembly (MEA) containing unsupported catalyst and the separate gas diffusion layer containing carbon particles.
- Loss of hydrophobicity of carbon particles is responsible for the increase of peroxide generation with the electrolysis time
- Low water activity at the reaction site promotes formation of peroxide.
- Elimination of peroxide from the caustic product stream was possible by modifying the cathode structure. However, the modified structure was more susceptible to flooding.
- Cathode hardware coating affects peroxide generation rate. The gold plated hardware destroys peroxide more efficiently at high current densities (0.8-1.0 A/cm2), whereas the silver plated hardware helps destroy peroxide at low current densities (0.2-0.4 A/cm2).
- Silver plated cathode hardware exhibits an excellent corrosion resistance both under open circuit conditions and during electrolysis.
- The products of sodium chloride oxidation, i.e., elemental chlorine, chlorate, hypochlorite, etc., contribute to the cathode hardware corrosion during uncontrolled interruptions of electrolysis and are also likely to cause catalyst loss from electrodes utilizing carbon supported platinum catalyst.
- Membrane-electrode-assemblies (MEAs) containing unsupported platinum catalyst offer excellent performance stability and exhibit excellent corrosion resistance during uncontrolled power outages, when the membrane remains in contact with concentrated brine.
- The degree of catalyst utilization in the MEA is significantly lower than in the cathode utilizing the carbon-supported catalyst with the same nominal loading.
- Prolonged contact of the MEA with water leads to significant delamination of the catalyst layer and the membrane. The increased and uneven swelling of the membrane and the Nafion binder is suspected to be a major factor responsible for the delamination.
- Extended power outages result in significant lowering of caustic current efficiency, especially when the cell is equipped with the hydrophilic spacer. The origin of this phenomenon is unclear.
Every new laboratory-scale technology requires a scale-up and eventually testing in a pilot plant, before it may be implemented. The conclusions summarized in this report pertain to small laboratory-scale cells and may turn out to be incorrect in the case of industrial-scale cells, where the electrode surface areas are at least two orders of magnitude larger. For instance, the current distribution over the membrane surface is uniform in the small cell, whereas it may be non-uniform in a larger cell because of the more demanding conditions of supplying the reagents to and removing the products from the reaction site in the latter case. Correcting the problem may require adjusting of the operating conditions, changing the hardware design or even installing additional hardware. Consequently, the scale-up stage will be an extremely important part of the research before the technology can be tested in a pilot plant and eventually implemented. However, an ordinary research laboratory cannot handle currents in excess of 100 A, which limits the size of the test cell to twice the size of the cells used in our study. This size is probably too small to provide reliable evaluation of the scale-up effects on the cell operation.
Consequently, the scale-up phase of the research must involve an industrial partner, who can perform the necessary testing of the scaled-up cells in their research facility. The industrial partner can also provide the high purity brine, which is hard to find on the market. Some manufacturers sell the brine, but in quantities that significantly exceed the needs of a research project. On the other hand, the quantity of brine used by our project, amounted to approximately 42 dm3 (11 gal) per day, when two cells were operated at 1.0 A/cm2. Such a quantity is too large to be processed in a research laboratory using a complex multi-step purification procedure, unless there is a separate purification system in place. However, the cost of the purification system and its maintenance may be prohibitively high given the volume of brine processed.
The best possible combination of industrial partners should involve a chlor-alkali producer and a chlor-alkali cell manufacturer. The collaboration with a chlor-alkali manufacturer is more desired from the standpoint of ongoing research because of the extent of services they can provide to the research team on a daily basis, e.g., brine supply, sample analysis, consultation, etc. The collaboration with a chlor-alkali cell manufacturer can be particularly helpful, when the technology development approaches the commercialization stage.
Acknowledgements
Financial support from the Industrial Technologies Program of the DOE is gratefully acknowledged.
Many thanks are due Sara Dillich and Mike Soboroff, DOE Program Managers and to Tom Baker and Melissa Miller, LANL Program Managers for their continuous support and interest in this research.
Student researchers Sarah Stellingwerf and Amanda Casteel were involved part time in this research. Their help is gratefully acknowledged.
The author is also grateful to the entire group MST-11 at LANL for their daily support and encouragement. Special thanks are due to former and current members of MST-11, Shimshon Gottesfeld, Ludwig Lipp, Mahlon Wilson, and Christine Zawodzinski for their creative contributions to previous research on oxygen-depolarized chlor-alkali cells and some ideas implemented in this research.
Very special thanks are due to Lawrence Bec Becnel, Bill Wood, and Delton Kayga of Texas Brine Company for their truly invaluable help in obtaining high purity brine after cooperative negotiations with a potential industrial partner failed and the project was in danger of being discontinued.
Supply of some materials used in these studies by William Meadowcroft and Robert Theobald of DuPont is greatly appreciated.
References
- G.Grizner, U.S. patents 4,035,254 and 4,035,255
- L.Gestaut, et al., Abstracts of ECS Fall Meeting, No. 393 (1983).
- T.Morimoto, K.Suzuki, T.Matsubara, N.Yoshida, Electrochim.Acta, 45(2000)4257.
- M.Sugiyama, K.Saiki, A.Sakata, H.Aikawa, and N.Furuya, J.Appl.Electrochem., 33(2003)929.
- N.Furuya, H.Aikawa, Electrochim. Acta, 45(2000)4251.
- K.Saiki, A.Sakata, H.Aikawa, N.Furuya in Chlor-Alkali and Chlorate Technology: R.B.MacMullin Memorial Symposium, The Electrochemical Society Proceedings, vol. 99-21, pp 188-195, The Electrochemical Society, Pennington, N.J., 1999.
- F.Federico, G.N.Martelli and D.Pinter in Modern Chlor-Alkali Technology vol. 8, John Moorhouse editor, Blackwell Science, 2001, chapter 9, pp.114-127.
- A.Ichinose, H.Aikawa, T.Watanabe and A.Uchimura in Chlor-Alkali and Chlorate Technology: R.B.MacMullin Memorial Symposium, The Electrochemical Society Proceedings, vol. 99-21, pp 216-222, The Electrochemical Society, Pennington, N.J., 1999.
- A.Sakata, N.Furuya, H.Aikawa and K.Saiki in Chlor-Alkali and Chlorate Technology: R.B.MacMullin Memorial Symposium, The Electrochemical Society Proceedings, vol. 99-21, pp 223-233, The Electrochemical Society, Pennington, N.J., 1999.
- K.Hayashi, A.Sakata, N.Furuya, H.Aikawa, K.Saiki in Chlor-Alkali and Chlorate Technology: R.B.MacMullin Memorial Symposium, The Electrochemical Society Proceedings, vol. 99-21, pp 209-215, The Electrochemical Society, Pennington, N.J., 1999.
- S.Nakamatsu, N.Furuya, K.Saiki, H.Aikawa, A.Sakata in Chlor-Alkali and Chlorate Technology: R.B.MacMullin Memorial Symposium, The Electrochemical Society Proceedings, vol. 99-21, pp 196-208, The Electrochemical Society, Pennington, N.J., 1999.
- United States Patent 6,117,286.
- United States Patent, No. US 5,693,202.
- German Patent, No. DE 19622744.
- F.Gestermann and A.Ottaviani in Modern Chlor-Alkali Technology vol. 8, John Moorhouse editor, Blackwell Science, 2001, chapter 4, pp. 49-56.
- W.C.Meadowcroft and R.D.Theobald in Modern Chlor-Alkali Technology vol. 8, John Moorhouse editor, Blackwell Science, 2001, chapter 6, pp.82-89.
- LQ.Mao, K.Arihara, T.Sotomura, T.Ohsaka, Electrochim.Acta 49(2004)2515.
- Y.Yang, Y.Zhou, J.Electroanal.Chem. 97(1995)271.
- S.trbac, R.R.Adic, J.Electroanal.Chem. 403(1996)169.
- Y.-F.Yang, Y.-H.Zhou, C.-S.Cha, Electrochim.Acta 40(1995)2579.
- S.trbac, R.R.Adic, Electrochim.Acta 41(1996)2903.
- C.-C.Chang, T.-C.Wen, H.-J.Tien, Electrochim.Acta 42(1997)557.
- K.Tammeveski, T.Tenno, J.Claret, C.Ferrater, Electrochim.Acta 42(1997)893.
- L.Geniès, R.Faure, R.Durand, Electrochim.Acta 44(1998)1317.
- 10. J.Perez, E.R.Gonzalez, E.A.Ticianelli, Electrochim.Acta 44(1998)1329.
- I.Morcos, E.Yeager, Electrochim.Acta 15(1970)953.
- Z.W.Zhang, D.Tryk, E.Yeager, J.Electrochem.Soc. 130(1983)C333.
- L.Nei, Fresenius J.Anal.Chem. 367(2000)436.
- J.-D.Kim, S.-I.Pyun, T.-H.Yang, J.B.Ju, J.Electroanal.Chem. 383(1995)161.
- H.-K.Lee, J.-P.Shim, M.-J.Shim, S.-W.Kim, J.-S.Lee, Mater.Chem.Phys. 45(1996)238.
- M.Chatenet, L.Genies, M.Aurousseau, R.Durand, and F.Andolfatto, J.Appl.Electrochem., 32(2002)1131.
- M.Chatenet, M.Aurousseau, R.Durand, and F.Andolfatto, J.Electrochem.Soc., 150(2003)D47.
- O.Ichinose, M.Kawaguchi, and N.Furuya, J.Appl.Electrochem., 34(2004)55.
- F.Aziz and G.A.Mirza, Talanta 11(1964)889.
- M.Ardon, Oxygen. Elementary Forms and Hydrogen Peroxide, The Physical Inorganic Chemistry Series (edited by R.A.Plane and M.J.Sienko), (W.A.Benjamin, New York, Amsterdam, 1965).
- P.S.D.Brito, C.A.C.Sequeira, J.Power Sources, 52(1994)1, and references therein.
- J.T.Keating, H.M.B.Gerner, High Current Density Operation The Behavior of Ion Exchange Membranes in Chloralkali Electrolyzers, Modern Chlor-Alkali Technology vol.7 (edited by S.Sealey, SCI 1998), Proceedings of the 1997 London International Chlorine Symposium Organized by SCI Electrochemical Technology Group, London, UK, 4th June 6th June (1997) pp 135-144.
- L.R.Czarnetzki, L.J.J.Janssen, J.L.Fernández,, J.Appl.Electrochem. 22(1992)315.
- CRC Handbook of Chemistry and Physics, 81st Edition, CRC Press, 2000.
