


Gravel contacts and geomembrane strains for a GM/CCL composite liner
R.W.I. Brachman*, S. Gudina1
Abstract
A method to record the shape, size, and spacing of gravel contacts that act on a geomembrane from an
overlying granular drainage layer is presented. The gravel contacts acting on a 1.5-mm thick, highdensity
polyethylene geomembrane are then quantified for two poorly graded, angular gravels (GP1 and
GP2 with nominal grain sizes of 50 and 25 mm) with compacted clay beneath the geomembrane and
when subjected to an applied pressure of 250 kPa. The geomembrane indentations and strains are also
reported. Five types of contacts were defined: point, edge, area, perimeter and composite. Point contacts
were the most frequent and, along with edge contacts, caused the steepest indentations and the largest
strains. The average spacings between gravel contacts were found to be 55 mm for GP1 and 37 mm for
GP2. Without a protection layer, the largest tensile strains in the geomembrane were 32 and 16% for GP1
and GP2, respectively. A nonwoven needle-punched geotextile was found to reduce the contact pressure
acting on and the resulting strains in the geomembrane. However, none of the geotextiles tested (with
masses up to 2240 g/m2) were able to limit the tensile strains below proposed allowable levels for longterm
strain even for the short-term conditions examined.
© 2008 Elsevier Ltd. All rights reserved.
1. Introduction
Geomembranes are thin planar structures (1.52.5 mm thick) that are commonly used with a low permeable layer (e.g., compacted clay or a geosynthetic clay liner) to act as a composite liner in modern engineered landfills. These composite liners provide an excellent hydraulic barrier provided that there are no holes in the geomembrane. Holes can arise from damage during installation and possibly from cracking under long-term tensions induced by overlying gravel drainage materials (e.g., see Rowe et al., 2004) and these holes can lead to liquid and gas movement through the composite liner (e.g., Bouazza et al., 2008; Saidi et al., 2008; Rowe et al., 2007, 2004; Barroso et al., 2006; Touze-Foltz et al., 2006; Rowe, 2005). Protection layers consisting of sand, geotextile, and/or geocomposite materials are therefore required to prevent shortterm puncture of the geomembrane and limit long-term tensions in the geomembrane.
However, quantifying long-term tensions in geomembranes is challenging and, at present, only an estimate of short-term tensions can be obtained from large-scale laboratory tests (e.g., Brachman and Gudina, 2008; Dickinson and Brachman, 2006; Gudina and Brachman, 2006; Tognon et al., 2000) or smaller scale tests (e.g., Darbyshire et al., 1997; Mu¨ ller, 2007). The paucity of data on the nature, size, spacing and magnitude of gravel contacts acting on the geomembrane (or the protection layer) is one obstacle to quantifying long-term tensions in the geomembrane. The nature of gravel contacts acting on a geomembrane may be expected to be influenced by the grain size, grain size distribution, grain shape and void ratio of the gravel.
It is desirable to use coarse gravel in the overlying leachate collection system to minimize the implications from biologically induced clogging (Fleming and Rowe, 2004). For example, landfill regulations in Ontario (MoE, 1998) require the drainage gravel to have 85% of the particles by mass not less than 37 mm, and 10% of the particles by mass not less than 19 mm (i.e., D85 > 37 mm and D10 >19 mm). Use of such coarse gravel results in larger and more widely spaced contact forces on the geomembrane (and hence larger strains) relative to finer gravel or sand. In many places, such coarse gravel is manufactured from crushing limestone, resulting in irregularly shaped, rough and angular particles overlying the geomembrane.
Knowledge of the nature of gravel contacts and associated strains is essential prior to numerical modelling of physical interactions between the gravel, protection layer and the geomembrane as it represents the top boundary condition acting on the composite liner. Knowing what a typical gravel contact is and what sort of contact leads to the largest geomembrane strains would also be valuable in designing simpler experiments (possibly only involving a single gravel particle) as well as aid in the interpretation of index tests where steel plates with fabricated protrusions have been used in experiments to simulate gravel particles (Brummermann et al., 1994; Narejo et al., 1996).
The objective of this paper is to quantify the gravel contacts that directly act on a geomembrane and the resulting geomembrane strains. Details of the experimental technique are reported. One particular high-density polyethylene (HDPE) geomembrane without any protection layer overlying compacted clay is examined at an applied vertical pressure of 250 kPa. Two different coarse gravels are examined. The effectiveness of nonwoven needle-punched geotextiles to reduce the geomembrane strains is also presented.
2. Experimental details
2.1. Test apparatus
The details of the experiments are reported by Gudina (2007) and only a brief overview is given here. The test apparatus is shown in Fig.1. A uniform vertical pressure is applied across the top surface by using a flexible rubber bladder, while horizontal pressures develop (corresponding to zero lateral strain conditions) by limiting the outward deflection of the test apparatus. The vertical stress reaching the geomembrane is reduced by less than 5% from friction along the vertical boundaries by using the system of Tognon et al. (1999) consisting of two layers of 0.1-mm thick polyethylene sheets lubricated with grease.

Fig. 1. Cross-section through experimental apparatus. Dimensions in millimetres.
The vertical pressure was applied in 50 kPa increments every 10 min until a maximum of 250 kPa was reached, and then held constant for 10 h. For reference, this corresponds to a waste height of approximately 18 m if the unit weight of the waste is taken to be 13 kN/m3 and accounting for 5% loss in the applied pressure to boundary friction. All experiments were conducted at a temperature of 21 ±2°C.
2.2. Materials tested
Table 1 summarizes the tests conducted. All tests were performed with a geomembrane (GM) overlying a compacted clay liner (CCL) and backfilled with a granular drainage layer as shown in Fig. 1.
| Test Clay water content (%) | Gravel | Protection layer | Pressure film | Lead sheet | Clay water content (%) |
| 1a | GP1 | None | 1 | Yes | 16.0 |
| 1b | GP1 | None | 1 | Yes | 16.3 |
| 1c | GP1 | None | 1 | Yes | 15.7 |
| 1d | GP1 | None | 1 | Yes | 15.5 |
| 1e | GP1 | None | 1 | Yes | 15.5 |
| 1f | GP1 | None | 1 | Yes | 16.1 |
| 1g | GP1 | None | 1 | Yes | 15.8 |
| 1h | GP1 | None | 1 | Yes | 15.9 |
| 1i | GP1 | None | 2 | No | 16.2 |
| 1j | GP1 | None | 2 | No | 16.6 |
| 1k | GP1 | None | 2 | No | 16.2 |
| 1l | GP1 | None | 2 | No | 16.8 |
| 1m | GP1 | None | 2 | No | 16.6 |
| 2a* | GP1 | None | None | Yes | 16.1 |
| 2b* | GP1 | None | None | Yes | 15.8 |
| 3+ | GP1 | None | None | Yes | 16.4 |
| 4a | GP2 | None | 1 | Yes | 16.2 |
| 4b | GP2 | None | 1 | Yes | 15.7 |
| 4c | GP2 | None | 1 | Yes | 15.9 |
| 4d | GP2 | None | 1 | Yes | 16.0 |
| 4e | GP2 | None | 1 | Yes | 16.1 |
| 4f | GP2 | None | 1 | Yes | 15.6 |
| 4g | GP2 | None | 2 | No | 15.9 |
| 4h | GP2 | None | 2 | No | 15.8 |
| 4i | GP2 | None | 2 | No | 16.0 |
| 4j | GP2 | None | 2 | No | 15.9 |
| 4k | GP2 | None | 2 | No | 16.1 |
| 5a | GP1 | GT1 | 1 | Yes | 16.3 |
| 5b | GP1 | GT1 | None | Yes | 16.1 |
| 5c | GP1 | GT1 | None | Yes | 16.0 |
| 5d | GP1 | GT1 | None | Yes | 16.2 |
| 5e | GP1 | GT1 | None | Yes | 15.9 |
| 6 | GP1 | GT2 | None | Yes | 15.8 |
| 7a | GP1 | GT4 | None | Yes | 15.6 |
| 7bt | GP1 | GT4 | None | Yes | 16.4 |
| 7ct | GP1 | GT4 | None | Yes | 15.3 |
| 8a§ | GP1 | GT4 | None | Yes | 16.1 |
| 8b§ | GP1 | GT4 | None | Yes | 16.6 |
| 9a | GP1 | GT4 | None | Yes | 16.2 |
| 9b£ | GP1 | GT4 | None | Yes | 16.0 |
| 9c£ | GP1 | GT4 | None | Yes | 16.6 |
| 10 | GP1 | GT5 | None | Yes | 15.6 |
| 11§ | GP1 | GT5 | None | Yes | 16.3 |
| 12 | GP1 | 150mm SP | 1 | Yes | 15.7 |
| 13 | GP2 | GT3 | None | Yes | 16.1 |
| 14 | GP2 | GT5 | None | Yes | 16.2 |
The soil used as the compacted clay liner was obtained from a landfill site in Milton, Ontario, Canada. The index properties of the clay are summarized in Table 2. The clay was compacted in two 50- mm thick lifts at a target moulding water content of 16%, which for this clay, represents the upper range of water content for field placement (Benson et al.,1999). The actualwater content of the clay for each test is given in Table 1.
A smooth HDPE geomembrane specimen with a diameter of 570 mm was placed on top of the clay. A 1.5-mm thick geomembrane was tested except in Tests 2 and 3 where 2.0- and 2.5-mm thick geomembranes were tested. Index tensile stress strain properties of the geomembranes are summarized in Table 3.
| Property | |
| Liquid limit (%) | 27 |
| Plastic limit (%) | 16 |
| Std Proctor optimum water content (%) | 12.2 |
| Std Proctor maximum dry density (g/m3) | 2.06 |
| Std Proctor maximum dry density (g/m3) | 1.84 |
| Specific gravity of soil solids () | 2.75 |
| Percent finer than 0.002 mm by mass (%) | 32 |
| Property | Machine direction | Cross-machine direction | ||||
| tGM (mm) | tGM (mm) | |||||
| 1.5 | 2.0 | 2.5 | 1.5 | 2.0 | 2.5 | |
| Yield strength kN/m) |
30 ± 0.6 | 39 ± 1.1 | 46 ± 0.4 | 31 ± 0.6 | 45 ± 0.5 | 46 ± 0.4 |
| Break yield strength (kN/m) |
49 ± 4 | 66 ± 3 | 93 ± 4 | 53 ± 5 | 69 ± 2 | 90 ± 5 |
| Yield elongation strain (%) |
21 ± 0.4 | 19 ± 0.4 | 20 ± 0.2 | 19 ± 0.5 | 17 ± 0.2 | 20 ± 0.1 |
| Break elongation strain (%) |
770 ± 70 | 780 ± 49 | 960 ± 32 | 880 ± 80 | 780 ± 31 | 960 ± 67 |
| 2% secant modulus (MPa) |
310 ± 10 | 290 ± 13 | 240 ± 6 | 320 ± 26 | 310 ± 16 | 240 ± 10 |
Two types of granular backfill materials denoted as GP1 and GP2 were tested. Grain size distributions are given in Fig. 2. GP1 is a nominal 50-mm poorly graded gravel that meets the requirements of Ontario landfill regulations (MoE, 1998), while GP2 is a nominal 25-mm poorly graded gravel that meets German landfill regulations (BAM, 1995). Both GP1 and GP2 were composed of crushed limestone. The gravel particles were irregularly shaped, rough and angular. Consistent with what would be done in the field for a real landfill, both materials were placed without compaction achieving an initial dry density of 1.5 g/cm3 for GP1 and GP2. The dry densities at the end of each test were found to increase to 1.64 and 1.60 g/cm3 for GP1 and GP2 from application of the applied pressure. The reported gravel contacts correspond to the denser final state of the gravel. A thin sand layer was placed above the gravel to prevent puncture of the bladder.
Tests 14 were conducted without a protection layer between the gravel and the geomembrane to permit a quantification of the gravel contacts acting directly on the geomembrane.
| Designation | Mass(g/m2) | Thickness(mm) | Offset tensile modulus (N/mm) | Offset (mm) | Secant modulus, 05 mm (N/mm) |
| GT1 | 390 | 3.0 | 171 | 14.0 | 2.7 |
| GT2 | 540 | 4.0 | 306 | 11.8 | 3.0 |
| GT3 | 570 | 4.1 | 171 | 15.6 | 2.1 |
| GT4 | 1230 | 9.5 | 167 | 15.1 | 2.6 |
| GT5 | 2240 | 16.4 | 247 | 17.8 | 3.4 |
In Tests 511, 13 and 14 a nonwoven needle-punched geotextile was used as a protection layer. Index properties of the geotextiles tested are given in Table 4. The forcedeflection response of the geotextiles was obtained from geotextile puncture test ASTM D6241, but using a 60-mm diameter specimen that was loaded by a steel probe machined to simulate a gravel particle to better simulate the physical conditions experienced by the geotextile when loaded in the test cell shown in Fig. 1. The offset tensile modulus is the maximum slope of the forcedeflection curves. The offset is a measure of the slack in the geotextile and corresponds to the displacement where a tangent through the point of maximum slope passes through zero force. The secant modulus between 0 and 5 mmof deflection quantifies the average stiffness over the range of gravel indentations anticipated for the pressures tested.
A 150-mm thick poorly graded sand (SP) was installed as a protection layer in Test 12. Its grain size distribution is given in Fig. 2. It was placed without compaction.
2.3. Technique to record gravel contacts
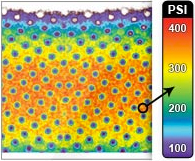
A very thin (<0.2 mm) pressure indicating film (Pressurex® Film, SPI, 2002)was used to obtain an imprint of the gravel contacts acting on the geomembrane. The pressure film produces an imprint on the application of pressure due to the rupture of microscopic capsules that release a liquid which cause patches of colours to be formed on the receiver (Liggins et al., 1995).
A 270 mm by 270 mm specimen of the filmwas placed between the geomembrane and gravel. The imprints were converted into digital images and an image analysis program was developed to quantify the spacing and size of the gravel contacts (Gudina et al., 2003).

Fig. 2. Grain size distribution of poorly graded gravels GP1 and GP2, and poorly graded sand SP.
 elevation and (b) plan
view.")
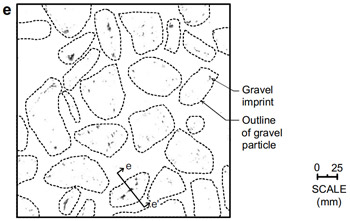
Fig. 3. Definition of gravel contacts on a geomembrane: (a) elevation and (b) plan view.
The final position of the gravel particles in contact with the geomembrane directly over the pressure film was preserved by injecting expanding foam through the open spaces in the neighbouring gravel particles and hence gluing the gravel particles together at the end of the test. The outline of the gravel particles in contact with the geomembrane was recorded onto tracing paper which was also scanned and digitized.
The hypothetical contact imprint for three neighbouring gravel particles (G1, G2 and G3) shown in Fig. 3 is used to illustrate how the contact size and spacing were defined. The size of each individual contact is characterized by an area Ac while the total contact area per gravel particle is designated as Ag. For gravel particles with multiple contacts Ag is equal to the sum of all Ac values for each gravel particle. The proportion of area that is in contact with the geomembrane is defined as the area ratio and is obtained by dividing the sum of all contact areas by the measurement area. The spacing between adjacent gravel particles Gi and Gj is defined as Sij. For gravel particles having only one contact (e.g., G3 in Fig. 3b) the spacing between adjacent contacts is taken as the distance between the centroids of contact imprints. For gravel particles having multiple contact points (e.g., G1 and G2) the spacing is taken relative to the centroid of all contacts per gravel particle. For each gravel type the contact spacings were calculated with respect to all neighbouring gravel particles. Thus for a gravel particle with five neighbouring particles, five contact spacings were obtained.
Two films with different sensitivities were tested and compared with the imprints from much more sensitive carbon paper. Film 1 with a pressure range of 1050 MPa detected only 70% of the contact area obtained with carbon paper, consequently, Film 1 was used to single out the contacts producing very large contact stresses. Film 2 with a range of 2.510 MPa measured essentially the same area as the carbon paper. The disadvantage of carbon paper is that it is very sensitive to scratching during gravel placement and removal, possibly leading to imprints that are not from gravel contacts. All subsequent results involving gravel contact imprints are reported from tests conducted with pressure Film 2. Consequently, the reported contacts are those causing a minimum contact pressure of 2.5 MPa.
The contact imprints reported in this paper were all obtained at an applied vertical pressure of 250 kPa. The number of contacts on the imprints is not expected to change with applied pressure, although the size of the contacts may increase with increasing pressure.
2.4. Method to quantify the indentations and strains in the geomembrane
A 0.4-mm thick, 270 mm by 270 mm soft lead sheet was placed between the geomembrane and the compacted clay to record the indentations in the geomembrane from the coarse gravel. At the end of the test, after removal of the gravel and geomembrane, a mould of the lead sheet was then cast to preserve the deformed shape of the lead sheet. The indentations in the deformed lead sheet were measured with a laser to an accuracy of ±0.1 mm. The strains in the geomembrane were then calculated from the measured indentations in the lead sheet using the method developed by Tognon et al. (2000). Tensile strains are taken as positive.
The possibility that the presence of the pressure film and the lead sheet influences the geomembrane strains (e.g., by altering the stiffness and/or interface strengths) was assessed by conducting experiments both with and without the pressure film and the lead sheet. The calculated strains from the five most prominent indentations in the geomembranes for these two experiments are given in Table 5. The strains with the pressure film and the lead sheet lie within the scatter of the strains obtained without the pressure film and the lead sheet. Therefore, the pressure film and the lead sheet do not appear to influence the calculated strains.
| Configuration | Indentation number | Average | ± 95% CI | ||||
| 1 | 2 | 3 | 4 | 5 | |||
| GMCCL | 21 | 16 | 15 | 12 | 9 | 14.4 | 3.9 |
| FGMPbCCL | 23 | 15 | 12 | 12 | 11 | 14.3 | 4.4 |
3. Results
3.1. Nature of gravel contacts
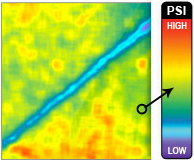
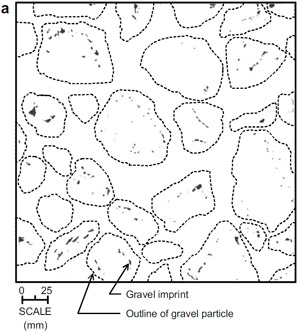
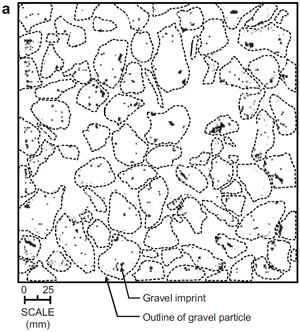
Figs. 4 and 5 show two typical sets of imprints of the contacts and the outlines of the gravel particles in contact with the geomembrane for the two types of gravels tested with no protection layer. Imprints from the other tests have been reported by Gudina (2007). Five common types of contacts were identified. They are illustrated in Fig. 6 and are defined as:
- Point contact caused by a gravel particle with a relatively small contact area (Fig. 6a). Single and multiple point contacts per gravel particle were observed.
- Edge contact resulting from a gravel particle resting on a sharp edge against the geomembrane (Fig. 6b). These produced long and narrow contacts.
- Area contact caused by a relatively flat side of the gravel particle resting on the geomembrane (Fig. 6c). The contact area was distributed over a large portion of the gravel particle resulting in many discrete contacts.
- Perimeter contact resulting from a relatively flat side of the gravel particle but with the outer perimeter of this side protruding out further than its interior (Fig. 6d).
- Composite contact caused by gravel particles that have two or more of the contact types. Composite contacts mainly result from large gravel particles with very irregular grain shapes.
| Test | Gravel | Contact type | ||||
| Point | Edge | Area | Perimeter | Composite | ||
| 1i | GP1 | 55 | 15 | 3 | 12 | 15 |
| 1j | GP1 | 43 | 6 | 3 | 17 | 31 |
| 1k | GP1 | 29 | 31 | 7 | 9 | 24 |
| 1l | GP1 | 25 | 11 | 4 | 7 | 54 |
| 1m | GP1 | 38 | 14 | 3 | 10 | 34 |
| Average of Tests 1i1m | GP1 | 38 | 15 | 4 | 11 | 32 |
| 4g | GP2 | 51 | 17 | 1 | 13 | 18 |
| 4h | GP2 | 37 | 15 | 0 | 21 | 27 |
| 4i | GP2 | 42 | 23 | 3 | 12 | 20 |
| 4j | GP2 | 21 | 14 | 7 | 19 | 39 |
| 4k | GP2 | 55 | 19 | 1 | 12 | 14 |
| Average of Tests 4g4k | GP2 | 41 | 18 | 2 | 15 | 24 |
 |
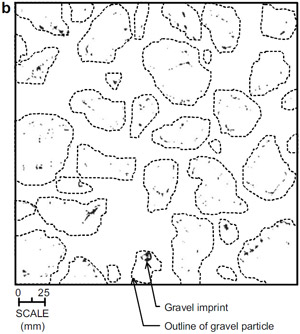 |
| Fig. 4. Gravel contact imprints and particle outlines with gravel GP1: (a) Test 1i and (b) Test 1j. | |
 |
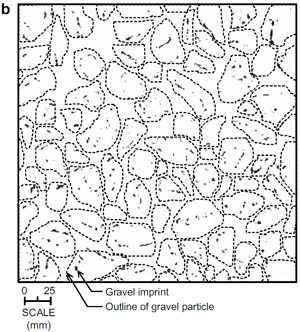 |
| Fig. 5. Gravel contact imprints and particle outlines with gravel GP2: (a) Test 5g and (b) Test 5h. | |
 point, (b) edge, (c) area, (d) perimeter, and (e) composite.")
Fig. 6. Types of gravel contacts: (a) point, (b) edge, (c) area, (d) perimeter, and (e) composite.
The proportion of contacts falling in each category is summarized in Table 6. Although there is considerable real variability in the data (i.e., inherent to the particle sizes, shapes, and distributions tested) point contacts constituted approximately 40% on average of the total contacts for both gravels tested, with up to 55% in Tests 1m and 4k. The next largest category was composite contacts with 32 and 24% of the contacts on average for GP1 and GP2, respectively. That the results between the two gravels are similar was expected since both were crushed from the same limestone, producing similar particle angularity, shape and roughness, but different particle size. The relation to geomembrane indentation and strain to the type of gravel contact is examined later in the paper.
3.2. Number of gravel particles in contact with the geomembrane
Table 7 summarizes the number of gravel particles in contact with the geomembrane for each test. On average there were 390 ± 40 contacts/m2 (where ±40 is the 95% confidence interval, CI, on the mean) with GP1, and 820 ± 40 contacts/m2 with GP2. That there are about half as many GP1 gravel particles in contact with the geomembrane compared with GP2 is consistent with the grain size of GP1 being approximately twice that of GP2.
| GP1 | Averagea | ±95% CIa | GP2 | Averagea | ±95% CIa | |||||||||
| Test | Test | |||||||||||||
| 1i | 1j | 1k | 1l | 1m | 4g | 4h | 4i | 4j | 4k | |||||
| Number of gravel contacts per film | 24 | 31 | 30 | 31 | 26 | 28 | 3 | 65 | 58 | 59 | 56 | 61 | 60 | 3 |
| Number of gravel contacts per m2 | 329 | 425 | 412 | 425 | 357 | 390 | 40 | 892 | 796 | 809 | 768 | 837 | 820 | 40 |
| Average contact spacing (mm) | 48 | 53 | 48 | 64 | 61 | 55 | 7 | 34 | 35 | 39 | 39 | 39 | 37 | 2 |
| Standard deviation of contact spacing (mm) | 15.9 | 14.1 | 13.3 | 19.2 | 13.9 | 7.6 | | 11.3 | 11.1 | 12.1 | 12.3 | 11.2 | 2.5 | |
| Area ratio (%) | 0.96 | 1.10 | 1.11 | 1.12 | 1.02 | 1.06 | 0.07 | 2.05 | 2.05 | 2.06 | 1.91 | 2.13 | 2.04 | 0.08 |
| Average contact size per gravel particle (mm2) | 29.2 | 25.9 | 27.0 | 26.3 | 28.6 | 27.4 | 1.25 | 23.0 | 25.8 | 25.5 | 24.9 | 25.5 | 24.9 | 0.98 |
3.3. Gravel contact spacing
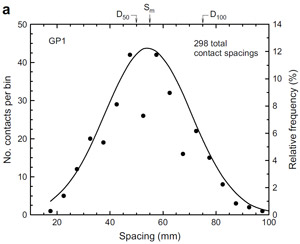
Frequency distributions of the spacing between adjacent gravel particles are presented in Fig. 7a and b for gravels GP1 and GP2, respectively, with no protection layer. Both data sets were shown that they could be described by a normal distribution based on a reduced chi-squared test (Gudina, 2007). Gravel GP1 had a mean contact spacing of 55 ±7 mm while GP2 had a mean spacing of 37 ±2 mm. For both gravel types, these mean spacings are larger than the respective D50 values of 47 and 26 mm for GP1 and GP2, but rather correspond to D85 for GP1 and D93 for GP2.
 |
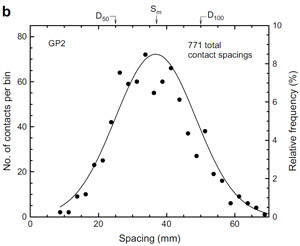 |
| Fig. 7. Contact spacing between neighbouring gravel particles: (a) GP1 and (b) GP2. Sm ¼ mean contact spacing; D50 and D100 = mean and largest gravel size, respectively. | |
If uniform spherical particles with simple cubic or cubic tetrahedral packing (e.g., see Mitchell and Soga, 2005) are assumed with the number of particles in contact with the geomembrane as reported in the previous section, contact spacings of 55 and 37 mm would be calculated for GP1 and GP2. In real gravel materials, smaller gravel particles will occupy spaces between larger particles, giving contact spacings less than the mean; whereas irregular particle shape would tend to lead to larger spacing between contacts. As suggested by Mitchell and Soga (2005), the net effect of these two factors may be that the mean of a uniformly graded gravel is not significantly different from that for uniform spheres.
However, Fig. 7 also shows that there are a number of very large contact spacings (relative to the particle size) with approximately 5% of the contact spacings greater than D100 (i.e., the maximum particle size) for both GP1 and GP2. These maximum spacings are much larger than those possible for the loosest arrangement of uniform spheres and occur for these gravels because of their irregular particle shape. Zones of the geomembrane with larger contact spacings may be expected to experience larger contact forces (since there is a larger contributing area to the contact force) that may be significant in terms of larger and more variable geomembrane strains.
3.4. Size of gravel contacts
The total area of gravel contacts recorded on the pressure film divided by the area of the pressure film is presented in Table 7 as the area ratio. This provides a measure of the average pressure acting on the geomembrane. For example, the average area ratio of 1% from five replicate tests for gravel GP1 means that the average contact pressure acting on the geomembrane is 100 times larger than the applied vertical pressure, i.e., 25 MPa on average. The average area ratio for gravel GP2 was 2%, resulting in an average gravel contact pressure of 12.5 MPa.
The distribution of contact areas for each individual gravel particle for GP1 is plotted in Fig. 8. These results show that there are predominantly small contacts with individual areas less than 40 mm2. There are also fewer but larger contacts acting on the geomembrane. The point contacts resulted in the smallest individual contact areas with all point contacts less than 30 mm2 each. The individual edge contacts range from small to 70 mm2 each, depending on the length of the edge contact. All perimeter contacts were less than 50 mm2. The area and composite contacts produced the largest individual contacts. If the force applied to the geomembrane were the same, one would then expect smaller contacts to lead to larger indentations as the force is spread out over a small area.

Fig. 8. Distribution of gravel contact sizes with gravel GP1.
3.5. Geomembrane indentations
The maximum indentation depth recorded in the lead sheet from each test is summarized in Table 8. The deepest indentations were found to be 12 mm for gravel GP1 and 5 mm for GP2. The deepest indentations were observed for point or edge contacts, as detailed in Table 8. The maximum indentation width is also reported in Table 8. With gravel GP1, the largest indentation was 50 mm wide, while it was 40 mm for GP2. The widest indentations were caused by edge, area, perimeter and composite type contacts.
| GP1 | GP2 | |||||||||||||
| Test | Test | |||||||||||||
| 1a | 1b | 1c | 1d | 1e | 1f | 1g | 1h | 4a | 4s | 4c | 4d | 4e | 4f | |
| Deepest indentation | ||||||||||||||
| Width (mm) | 45 | 35 | 42 | 45 | 44 | 50 | 43 | 50 | 30 | 23 | 18 | 24 | 25 | 35 |
| Depth (mm) | 8.4 | 10.2 | 8.1 | 10.3 | 8.5 | 12.0 | 8.3 | 10.9 | 3.8 | 4.6 | 4.8 | 3.9 | 3.5 | 4.9 |
| Strain (%) | 11 | 23 | 11 | 15 | 15 | 12 | 14 | 7.5 | 7.0 | 14 | 8.9 | 6.4 | 5.5 | 4.4 |
| Contact type | E | E | E | P | E | P | E | E | P | P | P | E | E | E |
| Widest indentation | ||||||||||||||
| Width (mm) | 45 | 41 | 48 | 46 | 44 | 50 | 49 | 50 | 30 | 31 | 37 | 35 | 31 | 40 |
| Depth (mm) | 8.4 | 2.6 | 6.0 | 5.9 | 8.5 | 12.0 | 7.4 | 10.9 | 3.8 | 4.1 | 3.5 | 2.4 | 3.4 | 3.4 |
| Strain (%) | 11 | 3.4 | 3.1 | 7.3 | 15 | 12 | 9.0 | 7.5 | 7.0 | 6.3 | 3.7 | 2.0 | 3.6 | 4.0 |
| Contact type | E | C | E | A | E | A | R | E | A | E | A | A | A | R |
| Indentation with largest strain | ||||||||||||||
| Width (mm) | 35 | 35 | 20 | 35 | 29 | 34 | 18 | 36 | 14 | 23 | 20 | 21 | 26 | 31 |
| Depth (mm) | 6.0 | 10.2 | 6.4 | 10.2 | 7.7 | 10.8 | 7.6 | 8.4 | 3.1 | 4.6 | 2.8 | 3.0 | 3.1 | 3.6 |
| Strain (%) | 18 | 23 | 28 | 32 | 23 | 18 | 18 | 20 | 14 | 14 | 16 | 16 | 12 | 11 |
| Contact type | E | E | P | P | E | E | P | P | P | P | E | P | E | E |
In only one test for each type of gravel (Test 1b for GP1 and 4b for GP2) did the maximum strain in the geomembrane (see Table 8) result from the deepest indentation. In none of the tests did the maximum strain arise from the widest indentation. The maximum strains tended to occur for deep and narrow indentations as detailed in Table 8 that had a depth to width ratio greater than 25%. These deep and narrow indentations tend to lead to greater tensile elongation half-way up the indentation.
3.6. Geomembrane strains
The geomembrane was not punctured in any of the tests; however, significant tensile strains were mobilized in the geomembrane. The geomembrane strains caused by the nominal 50 mmgravel with no protection layer are examined first in Figs. 9 13. The deformed shapes of the geomembrane indentations from gravel GP1 leading to the largest tensile strain in each of Tests 1a1e are shown in Figs. 9a13a, where h is the vertical distance above the deepest point of the indentation. The location of each section is shown on the contact imprints in Fig. 14. The calculated strains at the top and bottom surfaces of the geomembrane for each indentation are given in Figs. 9b13b. The largest tensile strain in seven out of the eight tests with lead sheets to permit calculation of strain occurred on the bottom surface of the geomembrane located roughly half-way up the indentation resulting from predominantly membrane stretching as the geomembrane is deformed by the intruding gravel particle. For example in Fig. 12b (Test 1d), a peak strain of 32% occurred -6 mm away from the deepest point of the indentation shown in Fig. 12a. Only in Test 1a (Fig. 9) was the maximum tensile strain located near the bottom of the indentation where bending effects are larger.
 and calculated strain (b) along Section aa0 from Test 1a.")
Fig. 9. Deformed shape (a) and calculated strain (b) along Section aa0 from Test 1a.
 and calculated strain (b) along Section bb0 from Test 1b.")
Fig. 10. Deformed shape (a) and calculated strain (b) along Section bb0 from Test 1b.
 and calculated strain (b) along Section cc0 from Test 1c.")
Fig. 11. Deformed shape (a) and calculated strain (b) along Section cc0 from Test 1c.
 and calculated strain (b) along Section dd0 from Test 1d.")
Fig. 12. Deformed shape (a) and calculated strain (b) along Section dd0 from Test 1d.
 and calculated strain (b) along Section ee0 from Test 1e.")
Fig. 13. Deformed shape (a) and calculated strain (b) along Section ee0 from Test 1e.
The largest strains from all tests with GP1 are summarized in Table 8. Out of the eight tests conducted with GP1 and a lead sheet, the maximum geomembrane strain of 32% occurred in Test 1d. This was caused by a point contact along Section dd0 in Fig. 14d. Table 8 shows that in all tests, the maximum geomembrane strain was caused by either point or edge contacts. This result is consistent with the small contact area between the gravel and geomembrane measured with these types of contacts, which leads to relatively deep and narrow indentations and hence large geomembrane strains relative to the other types of contacts. Each of the maximum strain locations had at least one neighbouring gravel contact at a spacing much larger than the mean spacing; however, no definitive trend between maximum strain and gravel spacing was found, although the variability in contact spacing contributes to large variability in strain examined below
 1a, (b) 1b, (c) 1c, (d) 1d, and (e) 1e.") |
 1a, (b) 1b, (c) 1c, (d) 1d, and (e) 1e.") |
 1a, (b) 1b, (c) 1c, (d) 1d, and (e) 1e.") |
 1a, (b) 1b, (c) 1c, (d) 1d, and (e) 1e.") |
 |
|
The maximum strains in Table 8 were obtained by analysing the five most prominent indentations in the geomembrane for each test. In Tests 1b, 1d and 1e the strains were calculated for all eightyeight of the discernible indentations in the lead sheets to better quantify the resulting distribution of strains. These results are plotted in Fig. 15. The strains for GP1 follow a normal distribution with an average strain of 12% and a standard deviation of 5%. There is some bias towards higher strain values in constructing the plots in Fig. 15 since all of the large indentations are analysed, but not all small indentations are even visible to permit calculation of strain. The variability in the strain distribution is large. For example, the overall maximum observed strain of 32% from the eight tests is four standard deviations larger than the mean. Although some of the variability may be from small variations in the clay subgrade stiffness, the majority is attributed to the variability in gravel contacts acting on the geomembrane.

Fig. 15. Distribution of geomembrane strains with gravels GP1 and GP2. No protection layer. P ¼ 250 kPa.
Now having the average and standard deviation, one can calculate that at least four replicate tests need to be conducted to obtain an estimate of the mean within 1% strain (at a 95% significance level). However, it is not as straightforward to establish how many replicate tests are required to capture the maximum strain (or rather, a certain large value of strain with a low probability of exceedance) given the large real scatter and few large strain data points per test. Based on the available data it can be said that out of the eight tests with GP1, just under 3% (7 out of 240) of the gravel indentations has strains that exceeded 21% the value that should correspond to 95% of the strains being smaller than if the strain distribution was normal and there were many more samples.
The strains from the five most prominent indentations from each test with the finer gravel GP2 are also reported Table 8. Again, they occurred from point or edge contacts. The distribution of all indentation strains from three tests of these tests (4a4c) is also shown in Fig. 15. The distribution is also normally distributed with a mean strain of 6% and a standard deviation of 3% and varies much less than the coarser GP1. The maximum calculated strain with GP2 was 16%.
The largest strains from Tests 2 and 3 (with geomembrane thicknesses tGM of 2 and 2.5 mm, but otherwise with the same test configuration as Test 1) are reported in Table 9 to provide an indication of the influence of the geomembrane thickness on the strains with gravel GP1. These results lie towards the larger values of strain from Tests 1ah (tGM= 1.5 mm) plotted in Fig. 15. This suggests that for the particular geomembranes tested the maximum strain is not significantly affected by the thickness of the geomembrane; however, there is not enough data to make a conclusive statement on this point. Although Narejo et al. (1996) showed an increase in puncture resistance with increasing geomembrane thickness (which is consistent with the increase in break elongation strain reported in Table 3), thicker geomembranes (up to 2.5 mm) may not significantly decrease the strains mobilized by the gravel because the stiffness of the geomembrane is small relative to the stiffness of the clay beneath the geomembrane.
| Test | Geomembrane thickness (mm) | Largest strain (%) |
| 2a | 2 | 28 |
| 2b | 2 | 29 |
| 3 | 2.5 | 30 |
3.7. Influence of a protection layer
One test conducted with a nonwoven needle-punched geotextile protection layer GT1, gravel GP1 and pressure Film 1 (Test 5a) resulted in no contact imprints on the film. Thus, protection layer GT1 limits the maximum contact pressure below 10 MPa for gravel GP1. This decrease in pressure may occur for two reasons. First, as the gravel particle deforms into the geotextile (e.g., Jones et al., 2000), the contact area between the gravel particle and underlying geotextile and geomembrane increases, thereby reducing the contact pressure. This is often referred to as cushioning. Second, as the geotextile deforms, membrane forces mobilize in the geotextile that also reduces the force reaching the geomembrane. However, Dickinson and Brachman (in press) showed that the forces mobilized in nonwoven needle-punched geotextiles are small for the magnitudes of deformation encountered here because of initial slack in their forcedeflection response, as evidenced by the small 0- to 5-mm secant moduli of the geotextiles in Table 4.
The strains calculated from the five most prominent indentations with various protection layers are given in Table 10. The largest strain from each test of these tests is plotted in Fig. 16. The maximum strains with a nonwoven needle-punched geotextile are much smaller than with no protection layer and decrease as the mass of the geotextile increases. The thin geotextile GT1 reduces the peak strain to 19% with gravel GP1. The distribution of strains with GT1 is also less variable than with no protection, as the geotextile reduces the extreme contact forces experienced by the geomembrane without protection.
| Test | Gravel | Protection | Calculated strains from five most prominent indentations (%) | ||||
| 5a | GP1 | GT1 | 16 | 13 | 12 | 12 | 11 |
| 5b | GP1 | GT1 | 19 | 13 | 13 | 10 | 8.7 |
| 5c | GP1 | GT1 | 13 | 12 | 12 | 11 | 11 |
| 5d | GP1 | GT1 | 15 | 14 | 14 | 13 | 11 |
| 5e | GP1 | GT1 | 17 | 16 | 15 | 14 | 13 |
| 6 | GP1 | GT2 | 15 | 9.6 | 8.7 | 1.0 | 5.7 |
| 7a | GP1 | GT4 | 9.1 | 8.8 | 4.9 | 4.5 | 4.2 |
| 7b | GP1 | GT4 | 13 | 11 | 9.8 | 7.4 | 7.3 |
| 7c | GP1 | GT4 | 9.4 | 8.6 | 6.2 | 5.3 | 4.9 |
| 10 | GP1 | GT5 | 8.2 | 6.9 | 5.4 | 5.2 | 3.3 |
| 12 | GP1 | SP | < 0.5 | | | | |
| 13 | GP2 | GT3 | 13 | 8.3 | 6.9 | 5.7 | 5.0 |
| 14 | GP2 | GT5 | 4.5 | 3.4 | 3.1 | 2.9 | 2.2 |
However, comparing the calculated strains with proposed maximum allowable limits of 3% (Seeger and Mu¨ ller, 2003) or 68% (Peggs et al., 2005) for HDPE geomembranes shows that none of the nonwoven needle-punched geotextiles tested were able to limit the strains to either proposed allowable level with gravel GP1 at 250 kPa. Only GT5 with the finer gravel GP2 was able to limit the strain below 5%; however, even this case is not recommended for practice because additional strain from creep effects and geotextile and geomembrane softening at higher temperatures may be expected to result in larger strains.
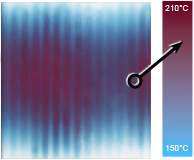
An indication of the rate of increase in strain with time is plotted in Fig. 17. These results are presented for gravel GP1 and geotextiles GT4 and GT5. For example with GT4, the maximum of three 1000-h tests is 1.15 times larger than the maximum of three 10-h tests. Tests are currently underway to quantify the increase in strains over one more log-cycle of time.
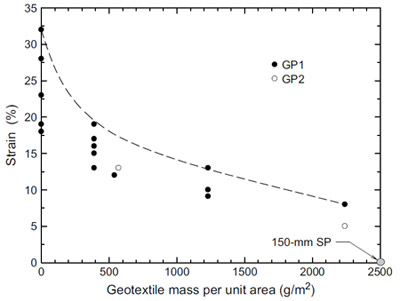
Fig. 16. Largest geomembrane strain from each test with a protection layer. P ¼ 250 kPa.

Fig. 17. Geomembrane strains versus test duration with gravel GP1. P ¼ 250 kPa.
In Test 12, a 150-mm thick sand protection layer was placed between gravel GP1 and the geomembrane. Only a very small portion of pressure Film 1 showed any change in colour after the test, suggesting that the contact pressure reaching the geomembrane is less than 10 MPa over the most of the loaded area. No discernible indentations were observed with the sand protection layer. The resulting geomembrane strains were less than 0.5%.
The effectiveness of a thick sand layer to limit geomembrane strains is consistent with the recommendations of Müller (2007) for gravel GP2. Tognon et al. (2000) found that short-term geomembrane strains could be limited below allowable limits with a sand-filled geocomposite with gravel GP1, even up to applied pressures of 900 kPa. Dickinson and Brachman (in press) showed promising results for geocomposite protection layers consisting of thin but stiff geotextiles above and below a thick nonwoven geotextile for a composite geomembrane/geosynthetic clay liner with gravel GP1 and at a pressure of 250 kPa. Issues of creep, softening of the geosynthetics with elevated temperature and service life of any such geosynthetic protection layer should be addressed, and these long-term tests are currently underway.
4. Conclusions
The nature, spacing and size of gravel contacts on a 1.5-mm thick HDPE geomembrane and the resulting strains in the geomembrane caused by two poorly graded, angular gravels (GP1 and GP2 with respective nominal grain sizes of 50 and 25 mm) were quantified for the case of compacted clay beneath the geomembrane and when subjected to an applied pressure of 250 kPa. For the particular conditions examined, the main findings are:
- (a) Gravel contacts: the gravel imposes highly variable loading on the geomembrane. Five types of contacts were identified: point, edge, area, perimeter and composite. For both gravel types, approximately 40% of the contacts were point contacts. The steepest geomembrane indentations and the largest geomembrane strains were caused by point and edge contacts. Approximately 400 and 800 gravel particles per square metre were in direct contact with the geomembrane for GP1 and GP2, respectively. The respective contact areas with GP1 and GP2 were 1 and 2% of the total loaded area. The average spacing between the neighbouring gravel particles in direct contact with the geomembrane of 55 and 37 mm were larger than the respective mean sizes for GP1 and GP2.
- (b) Geomembrane strains: the geomembranewas not punctured in any of the tests; however, significant tensile strains were mobilized in the geomembrane. Without a protection layer, the largest tensile strains in the geomembrane with GP1 and GP2 were 32 and 16%, respectively. The distributions of strains in the geomembrane were found to be normally distributed with average values of 12 and 6% for GP1 and GP2. A nonwoven needlepunched geotextile was found to reduce the contact pressure acting on and the resulting strains in the geomembrane. However, none of the geotextiles tested (with mass up to 2240 g/m2) were able to limit the tensile strains below proposed allowable levels even for the short-term conditions examined.
The results reported apply only for the specific test conditions involving short-term physical loading at a temperature of 21±2°C and as such will underestimate the strains expected under longterm conditions such as exposure to chemicals and elevated temperature conditions prevailing over extended periods of time.
Acknowledgements
This research was funded by the Natural Sciences and Engineering Research Council of Canada. The experimental apparatus was developed with funding from the Canadian Foundation for Innovation and the Ontario Innovation Trust. The geomembrane samples were generously provided by Layfield Plastics of Edmonton, Alberta, Canada. The image processing programwas developed by S. Vardy.
References
- Barroso, M., Touze-Foltz, N., von Maubeuge, K., Pierson, P., 2006. Laboratory investigation of flow rate through composite liners consisting of a geomembrane, a GCL and a soil liner. Geotextiles and Geomembranes 24 (3), 139155.
- Benson, C.H., Daniel, D.E., Boutwell, G.P., 1999. Field performance of compacted clay liners. ASCE Journal of Geotechnical and Geoenvironmental Engineering 125 (5), 390403.
- Bouazza, A., Vangpaisal, T., Abuel-Naga, H., Kodikara, J., 2008. Analytical modelling of gas leakage rate through a geosynthetic clay linergeomembrane composite liner due to a circular defect in the geomembrane. Geotextiles and Geomembranes 26 (2), 122129.
- Bundesanstalt fuer Materialforschung und pruefung (BAM), 1995. Anforderungen an die Scutzschicht fuer die Dichtungsbahnen in der Kombinationsdichtung, Zulassungsrichtlinie fuer Schutzschichten. Federal Institute for Materials Research and Testing, Certification Guidelines for Protection Layers for Geomembranes in Composite Liners (in German).
- Brachman, R.W.I., Gudina, S., 2008. Geomembrane strains from coarse gravel and wrinkles in a GM/GCL composite liner. Geotextiles and Geomembranes 26 (6), 488497.
- Brummermann, K., Bluemel, K., Stoewahse, C., 1994. Protection layers for geomembranes: effectiveness and testing procedures. In: Proceedings of the Fifth International Conference on Geotextiles, Geomembranes and Related Products, Singapore, vol. 3, pp. 10031006.
- Darbyshire, B., Warwick, R.G., Gallagher, E., 1997. Performance testing of protection materials for geomembranes. In: Dixon, N., Murray, E.J., Jones, D.R.V. (Eds.), Geotechnical Engineering of Landfills. Thomas Telford, UK, pp. 119129.
- Dickinson, S., Brachman, R.W.I. Assessment of alternative protection layers for a geomembrane/geosynthetic clay liner (GM/GCL) composite liner. Canadian Geotechnical Journal, in press.
- Dickinson, S., Brachman, R.W.I., 2006. Deformations of a geosynthetic clay liner beneath a geomembrane wrinkle and coarse gravel. Geotextiles and Geomembranes 24 (5), 285298.
- Fleming, I.R., Rowe, R.K., 2004. Laboratory studies of clogging of landfill leachate collection and drainage systems. Canadian Geotechnical Journal 41 (1), 134153.
- Gudina, S., 2007. Short-term Physical Response of HDPE Geomembranes from Gravel Indentations and Wrinkles. PhD thesis, Department of Civil Engineering, Queens University, Kingston, Ontario.
- Gudina, S., Brachman, R.W.I., 2006. Physical response of geomembrane wrinkles overlying compacted clay. ASCE Journal of Geotechnical and Geoenvironmental Engineering 132 (10), 13461353.
- Gudina, S., Brachman, R.W.I., Vardy, S., 2003. A method to quantify gravel contacts acting on geomembranes. In: Proceedings of the 56th Canadian Geotechnical Conference, Winnipeg, MB, pp. 459464.
- Jones, D.R.V., Shercliff, D.A., Dixon, N., 2000. Difficulties associated with the specification of protection geotextiles using only unit weight. In: Proceedings of the Second European Geosynthetics Conference, Bologna, Italy, pp. 551555.
- Liggins, A.B., Hardie, W.R., Finlay, J.B., 1995. The spatial and pressure resolution of Fuji pressure-sensitive film. Experimental Mechanics 35 (2), 166173.
- Mitchell, J.K., Soga, K., 2005. Fundamentals of Soil Behaviour, third ed. John Wiley & Sons, Hoboken, NJ.
- MoE, 1998. Landfill Standards: a Guideline on the Regulatory and Approval Requirements for the New or Expanding Landfilling Sites. Ontario Ministry of the Environment, Ontario Regulation 232/98. Queens Printer for Ontario, Toronto.
- Mu¨ ller, W., 2007. HDPE Geomembranes in Geotechnics. Springer-Verlag, Berlin, Heidelberg.
- Narejo, D., Koerner, R.M., Wilson-Fahmy, R.F., 1996. Puncture protection of geomembranes, part II: experimental. Geosynthetics International 3 (5), 629653.
- Peggs, I.D., Schmucker, B., Carey, P., 2005. Assessment of maximum allowable strains in polyethylene and polypropylene geomembranes. In: Geo-Frontiers 2005 (CD-ROM). American Society of Civil Engineers, Reston, VA.
- Rowe, R.K., 2005. Long-term performance of contaminant barrier systems, 45th Rankine Lecture. Geotechnique 55 (9), 631678.
- Rowe, R.K., Mukunoki, T., Bathurst, R.J., Rimal, S., Hurst, P., Hansen, S., 2007. Performance of a geocomposite liner for containing Jet A-1 spill in an extreme environment. Geotextiles and Geomembranes 25 (2), 6877.
- Rowe, R.K., Quigley, R.M., Brachman, R.W.I., Booker, J.R., 2004. Barrier Systems for Waste Disposal Facilities. E & FN Spon, UK.
- Saidi, F., Touze-Foltz, N., Goblet, P., 2008. Numerical modelling of advective flow through composite liners in case of two interacting adjacent square defects in the geomembrane. Geotextiles and Geomembranes 26 (2), 196204.
- Seeger, S., Mu¨ ller, W., 2003. Theoretical approach to designing protection: selecting a geomembrane strain criterion. In: Dixon, N., Smith, D.M., Greenwood, J.H., Jones, D.R.V. (Eds.), Geosynthetics: Protecting the Environment. Thomas Telford, London, pp. 137152.
- Sensor Products Inc., 2002. Color Correlation Manual for Pressure Interpretation (Pressurex®). SPI.
- Tognon, A.R., Rowe, R.K., Brachman, R.W.I., 1999. Evaluation of side wall friction for a buried pipe testing facility. Geotextiles and Geomembranes 17, 193212.
- Tognon, A.R., Rowe, R.K., Moore, I.D., 2000. Geomembrane strain observed in largescale testing of protection layers. ASCE Journal of Geotechnical and Geoenvironmental Engineering 126 (12), 11941208.
- Touze-Foltz, N., Duquennoi, C., Gaget, E., 2006. Hydraulic and mechanical behavior of GCLs in contact with leachate as part of a composite liner. Geotextiles and Geomembranes 24 (3), 188197.
