


On the mechanism of action of pneumatic compression devices: Combined magnetic resonance imaging and duplex ultrasound investigation
Fedor Lurie, MD, PhD,a,b Victoria Scott, BSc,c Hyo-Chun Yoon, MD, PhD,d and
Robert L. Kistner, MD,a,b Honolulu, Hawaii, and Los Angeles, Calif
From the John A. Burns School of Medicine, University of Hawaii,a Kistner Vein Clinic, Honolulu,b UCLA David Geffen School of Medicine, Los Angeles,c and Hawaii Permanente Medical Group, Inc.d
Competition of interest: none. Presented at the Twentieth Annual Meeting of the American Venous Forum, Charleston, SC, Feb 20-23, 2008.
Correspondence: Fedor Lurie, MD, PhD, John A. Burns School of Medicine, University of Hawaii, Kistner Vein Clinic, 848 S Beretania, Ste 307, Honolulu, HI 96813 (e-mail: [email protected]).
Copyright © 2008 by The Society for Vascular Surgery. doi:10.1016/j.jvs.2008.04.009
This study investigated the relationships between the interface pressure produced by intermittent pneumatic compression (IPC) devices, the deformation of extremity tissues produced by this pressure, and changes in venous blood flow associated with this deformation by use of magnetic resonance imaging (MRI) and duplex ultrasound (DUS) imaging in addition to the pressure measurement.
Methods:The calf garments of two IPC devices (WizAir, Medical Compression Systems, Inc, Ltd, Or-Akiva, Israel; VenaFlow, AirCast Inc, Summit, NJ) were tested in five healthy volunteers. The interface pressure was measured with Tactilus Human Body Interface sensor system (Sensor Products Inc, Madison, NJ). Changes in tissue volumes were assessed with MRI. Velocity and flow changes in the great saphenous vein (GSV) and femoral veins (FV) were evaluated by DUS scans.
Results:The spatial distribution of interface pressure differed substantially between the two devices. These differences were in the location and percentage of calf surface area to which different pressure was applied. Both devices produced the tissue compression consistent with each devices unique pattern of the interface pressure distribution. Compression by the IPC devices was associated with a measurable decrease in the volume of subcutaneous tissue under the garment, the total volume of superficial veins, and the volume of the GSV. No measurable changes occurred in subfascial volume of the calf. Compression was associated with significant increase in flow velocities in the GSV and FV. The increase of volume flow was significant in FV, but not in GSV. Comparing hemodynamic data with MRI data showed that the flow velocity increase in FV and GSV caused by IPC highly correlated with decrease in volume of superficial veins and subcutaneous tissue measured by MRI, but not with changes in subfascial volume. A single strongest predictor of venous flow increase was the change in subcutaneous veins volume.
Conclusions:This methodology provides means for the investigation of relationships between the pressure in the garment, interface pressure, tissue deformation, and hemodynamic respond to IPC. The clinical efficacy of IPC should not be explicitly attributed to the magnitude of the pressure in the garment. Similar hemodynamic responses to IPC can be produced by different spatial distributions of pressure resulting in different patterns of tissue compression. Further investigation of biomechanical mechanisms of IPC is needed to guide the development of better engineering solutions for mechanical devices aimed at prevention of venous thrombosis. ( J Vasc Surg 2008;48:1000-6.)
Clinical relevance:Prevention of venous thromboembolism remains an important clinical issue. Intermittent pneumatic compression (IPC) is one of the most frequently used mechanical preventive measures in immobile patients. Attempts to improve the clinical effectiveness of IPC and patient compliance are hindered by a gap in knowledge of basic biomechanical mechanisms of action of IPC. The methodology described in this report, and the results obtaining by using this methodology, provides means for further investigation of biomechanical mechanisms of IPC, which can lead to development of better engineering solutions for mechanical prevention of venous thrombosis.
Intermittent pneumatic compression (IPC) has been widely accepted as a standard component of deep venous thrombosis (DVT) prevention in immobile patients. Despite strong clinical evidence demonstrating efficiency of mechanical methods of DVT prevention, the mechanisms of their action are not well understood. The general concept that compressive force produced by mechanical devices deforms the veins, which in turn causes desirable physiologic effect, relies on broad assumptions that have not been confirmed or sufficiently studied.
The difference between hemodynamic effects produced by various IPC devices has been attributed to the differences in pressure in the garments of these devices.1,2 Although this pressure is known, the force extended by these devices to the skin surface (interface pressure) has not been investigated. This is despite the presence of a significant variety of materials and constructions of the garments that may result in different patterns of pressure actually applied to the extremity.
Diverse mechanical properties of skin, subcutaneous tissue, muscles, blood vessels, and osteofascial compartments, along with their complex interconnections, make questionable the assumption of direct translation of interface pressure into compression of veins. This aspect of the IPC has not been investigated either.
The gap in the knowledge of the relationship between pressure in the IPC garment, forces applied to the surface of extremity, the degree of tissue deformation, and the hemodynamic effect represents a significant barrier to the engineering of more efficient IPC devices and to the understanding of the physiologic mechanisms involved in DVT prevention by IPC. The means of measuring pressure, tissue deformation, and blood flow exist and have been used separately in clinical and biomechanical studies, but to our knowledge have never been used together within the framework of a single study. This study attempted to investigate the relationships between the interface pressure produced by IPC devices, the deformation of extremity tissues produced by this pressure, and changes in venous blood flow associated with this deformation by use of magnetic resonance imaging (MRI) and duplex ultrasound (DUS) scans in addition to the pressure measurement.
Methods
Five healthy volunteers (3 men, 2 women) participated in this study. They were aged 20 to 56 years, and their body mass indices (BMIs) were 20 to 25 kg/m2. No participants had a history of vascular abnormalities or abnormal findings on a baseline arterial and venous DUS scan of the lower extremities. All study subjects underwent DUS scan and MRI. In a separate set of experiments, the interface pressure delivered by the two selected IPC devices was studied in 10 healthy volunteers with a variety of leg sizes and shapes. The age range of these volunteers was 19 to 74 years, and their BMIs were 19 to 35 kg/m2. Three of the 10 volunteers also participated in the main study. The Hawaii Pacific Health Institutional Review Board approved the protocol and informed consent, which was obtained from each volunteer.
IPC devices. Two IPC devices with calf garments were selected for this study: VenaFlow (Aircast Inc, Summit, NJ) and WizAir (MCS Medical Compression Systems [DBN] Ltd, Or Akiva, Israel). Both devices are graduated and sequential; however, the temporal and spatial patterns of pressure delivery are very different, which was particularly interesting for this investigation.
VenaFlow has a rapid cycle of inflation with a 0.3- second delay between the two inflatable chambers (air cells) of the garment and 6 seconds of compression, followed by rapid deflation. According to the manufacturer, the Vena- Flow pump delivers the pressure of 52 mm Hg to the distal air cell and 45 mm Hg to the proximal air cell. The two air cells of VenaFlow garment are positioned at the posterior calf, and the other surfaces of the leg are compressed by nonstretchable material of the garment.
The WizAir compression cycle consists of slow inflation, immediately followed by slow deflation, and its pump pressure is in the range of 80 mm Hg by direct measurement. The WizAir garment consists of multiple cells connected into three sections and distributed evenly around the calf. Despite these differences, both of these devices are clinically effective in DVT prevention3 and produce similar hemodynamic responses.4,5
Interface pressure measurements. The measurements were performed using the Tactilus Human Body Interface sensor system (Sensor Products Inc, Madison, NJ), a matrix-based tactile surface piezoresistive sensor with a pressure measurement of 0 to 100 psi. The flexible sensing element is a 32- x 32-cm, 0.7-mm-thick sheet that is packed with 1024 sensing points spaced 2 mm apart. The system rapidly (100 readings per second) records and interprets pressure distribution and magnitude between any two contacting surfaces and assimilates the collected data into a Windows-based tool kit (Microsoft Corp, Redmond, Wash).

Fig 1. For the interface pressure measurement, the pressuresensing element (Tactilus Human Body Interface sensor system, Sensor Products Inc, Madison, NJ) was wrapped between the volunteers skin and the garment of intermittent pneumatic compression (IPC) devices.
The interface pressure was measured by wrapping the sensing element between the volunteers skin and the garment of IPC devices (Fig 1). The pressure magnitude and distribution were continuously recorded during three inflation cycles. Spatial pressure distribution was assessed by calculating the percentage of the surface of the calf undergarment to which different pressure was applied. The pressure intervals were used in increments of 10 mm Hg. The magnitude of pressure was assessed by calculating the mean of all individual pressure readings (frames) at a specific time intervals: during inflation, at time of maximal inflation of the garment, and during its deflation. The mean peak interface pressure was defined as the average reading of all sensing points (all surface area under garment) during time of maximal inflation of the garment.
To study the reproducibility of the interface pressure magnitude and distribution, the measurements were repeated three times in each volunteer at different times of the day. All measurements for each individual were performed ≤ week.
Magnetic resonance imaging. MRI images were acquired on a Philips 1.5T magnet (Philips Medical Systems, Bothell, WA) using a dedicated extremity coil. The following parameters were used: repetition time, 440 ms; echo time, 13 ms; 4-mm slice thickness with 0-mm gap; 180-mm field of view; matrix, 512 x 512 or 1024 x 1024; 20 slices were acquired; and number of excitations, 4. An 80-mm section of the calf was imaged at the center of the garment.
A deflated garment of one of the two IPC devices was placed on the volunteers calf, and the volunteer was placed on the imaging table in a supine position with the heel of the foot resting on a block so the calf was not touching any surfaces. The baseline images were obtained.
The patient was then partially removed from the bore of the magnet and the calf garment inflated using the IPC pump. The pump was allowed to run through three compression cycles, and then stopped at the point of maximum inflation. At this time, the pressure was maintained in the garment by closing a valve attached to the tube between the pump and the garment. Then, the pump was detached and removed. The compression MRI was performed once the patient was advanced back into the magnet bore. The calf garment remained secured on the volunteers lower extremity and the position of the volunteer and the leg were not altered during this procedure.
This procedure was repeated for each volunteer using both devices in random order. The pressure in the garment was measured after completion of the imaging to ensure that it had not changed during the study. The time required to perform all MRIs for each volunteer was about 20 minutes. For each device, at least one baseline and two compression MRIs were acquired for each volunteer.
The ImageJ software package (National Institutes of Health, Bethesda, Md) was used to analyze the images. They were first converted to 8-bit images, and then the threshold value of the background pixels was determined. Two times the mean standard deviation of the pixel values of the black background of the image was added to the mean value of the pixels found in the muscle region. These mean values were calculated using three regions of interest. The images were analyzed at a 200% zoom level. The venous threshold was determined using the first slice of each set of MRIs and used for all the slices in that set. To determine which pixels were above the venous background threshold, the Threshold tool was used.
For each set of slices, the area of the great saphenous vein (GSV), the small saphenous vein (SSV), and other superficial veins were measured. The total area of the calf, the area of the subcutaneous tissue layer, including the veins, and subfascial area were also measured on each slice. Because the scan length (80 mm) and the number of slices (20) were the same for all studies, the volume of each of the anatomic structures was defined as a sum of areas on individual slice images.
The measurement of the area of deep veins in the calf presented a particular challenge. The complex orientation of veins, their multiple interconnections, and the presence of intramuscular venous sinuses made it impossible to measure deep venous volume at a sufficient level of accuracy. Changes in the volume of the subfascial space, defined as tissue surrounded by the most superficially positioned deep fascia, was used as a surrogate for measuring changes in deep vein volume. Because calves volumes and vein sizes varied significantly between subjects, relative change of volumes was used for analysis after the statistical significance of change in volume was tested by paired t test.
Duplex ultrasound imaging. The DUS studies were performed using Logiq 700 scanner (GE Medical Systems, Waukesha, Wis) with 5- to 8-MHz linear array probe. Scans were performed with volunteers in the supine position after 15 minutes rest. A deflated garment of one of the IPC devices was placed on the volunteers calf, and the baseline measurements of diameter, peak venous velocity, and volume flow were performed in the femoral vein (FV) and the GSV at 20 cm proximally to the proximal edge of the garment (about 10 cm proximal to the knee). This point of measurement was selected to be close to the compressed segment, but not affected by the tissue motion. To minimize the probe pressure, a 1-cm layer of ultrasonic gel was placed on the skin, and the image was monitored to assure that the probe was not touching the skin.
The IPC pump was then activated and allowed to run for 5 minutes to stabilize the hemodynamic effect. The measurements were repeated during three compression cycles, and the average values were used for analysis. The two devices were studied in a random order. To address the reproducibility of the hemodynamic effect of IPC devices, each volunteer was studied three times: twice at a different time of day (morning and evening) and one time with simultaneous interface pressure measurement. The hemodynamic response to IPC was not different between the three scans: The difference in peak venous velocity and volume flow values was < 5%.
Statistical analysis. Descriptive statistics were reported as mean ± standard error of the mean. The paired t rest was used for normally distributed data; otherwise, the Wilcoxon matched-pairs test was used. The Mann-Whitney U test was used for comparison between the two IPC devices. Linear regression and the Pearson correlation coefficient were used for analysis of the relationship between variables. Analysis was performed with SPSS 11.5 statistical software (SPSS Inc, Chicago, Ill). P < .05 was assigned as significant.
RESULTS
Interface pressure. At the time of maximal inflation, the mean peak interface pressure (MPIP) was 29 ± 3 mm Hg for WizAir and 47±5mmHg for VenaFlow (P<.01). The pressure at individual measuring points at the same time was 5 to 97 mm Hg under the WizAir garment, and 0 to 140 mm Hg under the VenaFlow garment. The peak interface pressure point was reached at 5.0 ± 0.2 seconds from the start of inflation by WizAir and at 1.0 ± 0.1 seconds by VenaFlow.
The spatial distribution of interface pressure differed substantially between the two devices. These differences were in the location and percentage of calf surface area to which different pressure was applied and were most dramatic at the point of maximally inflated garment (Fig 2). The interface pressure was > 70 mm Hg at 6% of the surface under the fully inflated WizAir garment and at 26% of the surface under the fully inflated VenaFlow garment (corresponding means were 5.88% ± 0.18% and 25.84% ± 0.36%; P < .01). The WizAir garment did not extend the pressure to >100 mm Hg to any point on the surface under garment; however, 13% of the surface under VenaFlow garment had an interface pressure of >100 mm Hg at maximum inflation.

Fig 2. Results are shown for the spatial distribution of the interface pressure the during compression cycle for the (A-C) WizAir (Medical Compression Systems, Inc, Ltd, Or-Akiva, Israel) and (D-F) VenaFlow (AirCast Inc, Summit, NJ) intermittent pneumatic compression devices: inflation (A, WizAir; D, VenaFlow), maximally inflated garment (B, WizAir; E, Venaflow), and deflation (C, WizAir; F, VenaFlow). The category axis represents interface pressure in mm Hg, and the value axis represents percentage of surface under the garment with certain interface pressure. Mean values are shown with the error bars representing the standard error of the mean.
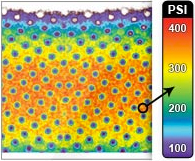
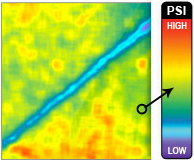
All high pressure points under VenaFlow garment were located at the surface of the posterior calf at the contours of the gastrocnemius muscle, and almost no pressure was extended to lateral and medial calf. In contrast, the high pressure points under WizAir garment were evenly distributed around the calf surface (Fig 3).
Repeated measurements of the interface pressure showed very little variability for both devices, and the differences between three measurements performed at different times of the day did not exceed 5% of the mean value for the magnitude of pressure, inflation time, compression time and spatial distribution.
Tissue deformation. In uncompressed leg, the mean total volume of superficial veins was 4.3% ± 1.6% (range, 3.5%-6.8%) of subcutaneous volume. Compression by both of the tested devices was associated with measurable decrease in volumes of subcutaneous tissue and superficial veins. The subcutaneous tissue decreased its volume on average by 3.6%±0.9% (P<.001), and the total volume of superficial veins was decreased on average by 23.6% ± 4.6% (P = .02). The GSV was compressed on average by 27.7% ± 5% (P = .017). There were no measurable changes in subfascial volume of the calf under the garment (the mean change was 1.3% ± 1.8%, P = .074).
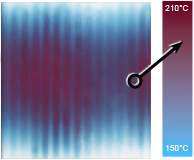
The difference in degree of tissue compression produced by the two IPC devices was not statistically significant; however, the distribution of subcutaneous tissue deformation was very different. Compression by WizAir consistently produced a pattern of regular sequence of compressed and uncompressed areas where compressed areas corresponded to a group of two to three air cells (Fig 4). Compression by VenaFlow resulted in deformation in anterior-posterior direction, with most of the compression in posterior calf.
Outflow changes. Compression by both of the IPC devices was associated with a significant increase in flow velocities in the GSV and FV. Maximum peak velocity in the GSV increased from 9.8±1.5 cm/s at baseline to 46.9± 10.7 cm/s with compression (P = .01), and FV velocity increased to 57.4 ± 14.9 cm/s (P = .014). The increase in flow velocity in the FV and the GSV significantly correlated (r = 0.79, P < .01). The volume flow in FV increased from 214.1 ± 61.8 mL/min at baseline to 578.6 ± 152.3 mL/min (P = .01); however, the increase of volume flow in GSV was not statistically significant (P = .07). This was at least in part due to a decrease in GSV diameter in response to velocity surge (P = .035), which was not observed in the FV (P = .42).

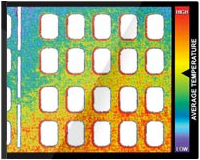
Fig 3. Images show the spatial distribution of the interface pressure by a maximally inflated garment. Color represents the magnitude of pressure from 0 to 150 mm Hg, as on the scale at the center.

Fig 4. Magnetic resonance images are shown at (A) baseline and with maximally inflated garment of (B) VenaFlow (AirCast Inc, Summit, NJ) and (C) and WizAir (Medical Compression Systems, Inc, Ltd, Or-Akiva, Israel).
The delay between the time point when interface pressure reached the peak value and the flow velocity reached its peak value was 1.8 ± 0.2 seconds for WizAir and 0.4 ± 0.1 seconds for VenaFlow. There was no measurable difference in this delay for the GSV and the FV.
Comparing hemodynamic data obtained by DUS scan with MRI data for the same volunteers showed that the flow velocity increase in the FV and GSV caused by IPC highly correlated with the decrease in the volume of superficial veins and subcutaneous tissue measured by MRI (r = 0.77 and r = .74 respectively), but not with changes in subfascial volume (r = 0.3 and r = 0.15). The single strongest predictor of venous flow increase was the change in subcutaneous venous volume (r2 = 0.73, P = .002; linear regression).
DISCUSSION
The hemodynamic effect of IPC is considered to play the central role in the prevention of venous thrombi. Although details of this mechanism and its relationship with other biologic effects of IPC still need to be defined and studied,2 the increase in venous flow is a commonly accepted surrogate measure of IPC efficacy.1 The preventive action of passive mechanical devices, such as stockings and bandages, has been investigated extensively with particular focus on interface pressure they produced.6 These investigations uncovered complexity of the subject and resulted in standardization of the investigational protocols.7 It also became clear that many assumptions about the mechanisms of action of these devices are questionable, and some are likely to be false.8 It was demonstrated, for example, that compression stockings do not cause deformation of veins, which was thought to be the mechanism of their action.9
Interface pressure produced by IPC has not been reported, to our knowledge, in peer reviewed journals. Our experiments showed that the assumption that IPC devices extend pressure equal or similar to the pressure inside the garment is not always true. One of the two studied devices produced interface pressure significantly lower than the pressure in the garment. More importantly, spatial distribution of the interface pressure differed markedly between the devices. If external forces are equally distributed around the extremity, as is commonly assumed for compression stockings, the interface pressure at each point of the calfs surface is governed by the Laplace Law [p = S/r], where p is a pressure at a particular point, S is a transversal force, and r is the radius of the extremity at this point. Thus, the highest pressure should be registered at the areas with smallest radius, like the anterior shin. Direct measurements performed in this study demonstrated a very different spatial distribution of the interface pressure (Fig 3). This indicates that garments of IPC devices apply significantly different pressure to different areas of the calf.
These differences in interface pressure are likely to play a key role in observed differences in tissue deformation. Our MRI-based observations showed that both devices produced the pattern of tissue compression consistent with each devices unique pattern of the interface pressure distribution (Fig 4).
Despite differences in spatial pattern, the magnitude of tissue deformation was not significantly different between the two devices. This contradicts predictions of previously published computational models10,11 that suggest asymmetric anterior-poster compression is superior to circumferentially uniform interface pressure.10 These models consider the soft tissues surrounding veins to be incompressible. Our observations do not support this assumption. Inflation of the garment of IPC devices caused a 3.6% decrease of subcutaneous tissue volume. Although the total volume of superficial veins was decreased by 23.6%, it cannot explain the magnitude of change in the volume of subcutaneous layer. Superficial veins constituted 4.3% of the total volume of subcutaneous tissue; thus, even a 30% decrease in their volume can explain only half of the magnitude of subcutaneous volume change. The subcutaneous tissue therefore is compressible. It is possible and likely that at least a part of this compression is caused by the shifting of extravascular fluid into the intravascular space and from subcutaneous veins into the subfascial veins. This possible transition of blood from superficial veins to deep veins may partly explain our observation of the lack of changes in subfascial volume.
Another assumption commonly used in computational models, as well as in clinical reports, is that an increase in venous blood flow velocities is caused mainly if not entirely by displacement of blood from deep veins of the calf.10,12 Our observations indicate that superficial veins and possibly fluid shift into intravascular space may significantly contribute to the hemodynamic effect of IPC. We observed increased flow velocities in both the FV and GSV; however, volume flow was increased significantly only in the FV, but not GSV, due to a decrease in the GSV diameter. Flow changes in the FV and GSV correlated with a decrease in volume of the superficial veins and subcutaneous tissue, but not with changes in subfascial volume. The absence of significant changes in subfascial volume indicates that if compression of deep veins did occur undetected by our methods, it was substantially less than the compression of subcutaneous tissue. Published direct measurements of changes in deep vein diameter under compression are in line with our observations.13 The pressure necessary to cause deformation of deep calf vein is much higher than the pressure applied by the two investigated devices. This also explains the findings that high-pressure pumps produce a more prominent hemodynamic effect.1,2 The pressure in these devices garments is three times higher than in the two investigated devices, which likely results in interface pressure sufficient to compress deep veins.
It has been previously demonstrated that IPC causes a higher flow increase in the head-up position of the patient compared with horizontal or head-down positions.14 Therefore, the same external pressure produced a better hemodynamic response not when the intravenous pressure is lower but when the venous volume is higher. This was confirmed by studying devices optimized to achieve maximal refill of calf veins between the compression cycles.15 Interestingly, the refill time in this device was defined by measuring the calf volume, which reflects not only refill of veins but also the refill of extravascular fluid. If confirmed, the hypothesis that compression of superficial veins and subcutaneous tissue can produce necessary hemodynamic effect has potentially important practical applications. It has been shown that patient compliance is significantly better with lower-pressure pumps5 and that better patient compliance is associated with better DVT prevention.16 Therefore, the development of efficient low-pressure devices may lead to improvement of DVT prevention.
The main limitations of research methodology used in this study are that measurements of interface pressure and hemodynamic response were performed at a different time than the MRI imaging, and that MRI imaging was performed with a static pressure. These limitations were unavoidable due to restrictions of available MRI technology. However, multiple repeated measurement of the interface pressure in a variety of legs and at a different time of the day showed little variability. The same was true for DUS measurements and for repeated MRI images. This leads us to believe that obtaining different than our results by simultaneous use of all three techniques is unlikely.
The MRI measurements analyzed in our study reflect tissue deformation at the peak of garment inflation. Therefore associations between tissue deformation and flow changes are questionable, because hemodynamic response can be caused by the dynamic nature of IPC.
However, the delay between the time when garment pressure reached its peak and the time when flow velocity reached its maximum falls within the interval predicted by the distance between the center of the garment and the DUS probe. In other words, the maximal hemodynamic action in the calf coincides with maximal garment inflation. This allows us to assume that the dynamic component of tissue deformation can be ignored, and the end result of compression as reflected by a static MRI image is sufficient for investigation of relationship between the external pressure, the deformation of soft tissues, and the hemodynamic changes. This assumption is in agreement with a previously published experiment that demonstrated that initial rapid change in calf volume is associated with deformation of the soft tissue if followed by much slower change due to movement of blood in the veins in response to external compression of the calf.17
CONCLUSIONS
The methodology described in this report provides means for the investigation of relationships between the pressure in the garment, interface pressure, tissue deformation, and hemodynamic respond to IPC. The results of this study indicate that the clinical efficacy of IPC should not be explicitly attributed to the magnitude of the pressure in the garment. Similar hemodynamic responses to IPC can be produced by different patterns of spatial pressure distribution resulting in different patterns of tissue compression. Further investigation of biomechanical mechanisms of IPC is needed to guide the development of better engineering solutions for mechanical devices aimed to prevention of venous thrombosis.
AUTHOR CONTRIBUTIONS
Conception and design: FLAnalysis and interpretation: FL, VS, RK, HCY
Data collection: VS, FL, HCY
Writing the article: FL, VS
Critical revision of the article: FL,RK
Final approval of the article: FL, VS, HCY, RK
Statistical analysis: FL, VS
Obtained funding: FL, RK
Overall responsibility: FL
8. REFERENCES
- 1. Labropoulos N, Cunningham J, Kang SS, Mansour MA, Baker WH. Optimising the performance of intermittent pneumatic compression devices. Eur J Vasc Endovasc Surg 2000;19:593-7.
- Malone MD, Cisek PL, Comerota AJ Jr, Holland B, Eid IG, Comerota AJ. High-pressure, rapid-inflation pneumatic compression improves venous hemodynamics in healthy volunteers and patients who are post-thrombotic. J Vasc Surg 1999;29:593-9.
- Ben-Galim P, Steinberg EL, Rosenblatt Y, Parnes N, Menahem A, Arbel R. A miniature and mobile intermittent pneumatic compression device for the prevention of deep-vein thrombosis after joint replacement. Acta Orthop Scand 2004;75:584-7.
- Labropoulos N, Oh DS, Golts E, Kang SS, Mansour MA, Baker WH. Improved venous return by elliptical, sequential and seamless air-cell compression. Int Angiol 2003;22:317-21.
- Murakami M, McDill TL, Cindrick-Pounds L, Loran DB, Woodside KJ, Mileski WJ, et al. Deep venous thrombosis prophylaxis in trauma: improved compliance with a novel miniaturized pneumatic compression device. J Vasc Surg 2003;38:923-7.
- Partsch H, Partsch B, Braun W. Interface pressure and stiffness of ready made compression stockings: comparison of in vivo and in vitro measurements. J Vasc Surg 2006;44:809-14.
- Partsch H, Clark M, Bassez S, Benigni JP, Becker F, Blazek V, et al. Measurement of lower leg compression in vivo: recommendations for the performance of measurements of interface pressure and stiffness: consensus statement. Dermatol Surg 2006;32:224-32.
- Mosti GB, Mattaliano V. Simultaneous changes of leg circumference and interface pressure under different compression bandages. Eur J Vasc Endovasc Surg 2007;33:476-82.
- Lord RS, Hamilton D. Graduated compression stockings (20-30 mmHg) do not compress leg veins in the standing position. ANZ J Surg 2004;74:581-5.
- Dai G, Gertler JP, Kamm RD. The effects of external compression on venous blood flow and tissue deformation in the lower leg. J Biomech Eng 1999;121:557-64.
- Narracott AJ, John GW, Hose DR, Morris RJ, Woodcock JP, Lawford PV. Influence of intermittent compression cuff design on calf deformation: computational results. Conf Proc IEEE Eng Med Biol Soc 2007; 1:6334-7.
- Narracott AJ, John GW, Hose DR, Morris RJ, Woodcock JP, Wilkinson ID, et al. Effect of intermittent compression of the calf on deep vessel collapse and implications for venous haemodynamics. Proceedings of the 1st International Conference on Advancements of Medicine and Health Care through Technology, MediTech2007, Cluj-Napoca, Romania 27-29th September. Acta Electrotehnica 2007;48:375-9.
- Partsch B, Partsch H. Calf compression pressure required to achieve venous closure from supine to standing positions. J Vasc Surg 2005;42: 734-8.
- Lurie F, Awaya DJ, Kistner RL, Eklof B. Hemodynamic effect of intermittent pneumatic compression and the position of the body. J Vasc Surg 2003;37:137-42.
- Griffin M, Kakkos SK, Geroulakos G, Nicolaides AN. Comparison of three intermittent pneumatic compression systems in patients with varicose veins: a hemodynamic study. Int Angiol 2007;26:158-64.
- Comerota AJ, Katz ML, White JV. Why does prophylaxis with external pneumatic compression for deep vein thrombosis fail? Am J Surg 1992;164:265-8.
- Zicot M, Parker KH, Caro CG. Effect of positive external pressure on calf volume and local venous haemodynamics. Phys Med Biol 1977;22: 1146-59.
