G.P. Voller a,*, M. Tirovic b,1
*a Artemis Intelligent Power Ltd., Sanderson Building, Mayfield Road, Edinburgh EH9 3JL, Scotland, United Kingdom
b Cranfield University, Cranfield MK43 0AL, England, United Kingdom
*Corresponding author. Tel.: +44 (0) 131 650 7481.
E-mail addresses: [email protected] (G.P. Voller), [email protected] (M. Tirovic).
1Tel.: +44 (0) 1234 754 648.
Abstract
As part of commercial vehicle disc brake heat dissipation research, thermal contact resistance (TCR) across a bolted joint is analysed. Studies include new and slightly corroded interface surfaces. Measurements show that corrosion approximately doubles TCR, decreasing conductive heat dissipation, leading to higher brake temperatures. To reduce TCR, two methods of interface conditioning are investigated. The application of thermal conductance paste and the use of a thin aluminium gasket at the interface have similar effects, reducing TCR by over 80%. The paper deals with the methodology of measuring TCR and defining its relationship with the change of interface pressure, temperature and interface conditioning. This approach ensures results of a generic nature applicable to a variety of bolted joints.
Keywords — Interface pressure; Bolted joints; Thermal contact resistance; Thermal conductance; Brake disc

1. Introduction
Accurate values of thermal contact resistance (TCR) are vital for heat transfer calculations across bolted joints. Reliable heat transfer predictions are important for many bolted joints, for a variety of reasons. In this study, a commercial vehicle (CV) disc brake assembly, shown in Fig. 1, was analysed. The heat generated at disc friction surfaces, and conducted through disc ‘top hat’ section, has two possible conductive paths. One, through the disc/wheel carrier interface and, the other, through the disc/bearing (outer ring) interface. The wheel carrier has substantial mass and is exposed to external fast flowing cold air, providing considerable potential for heat dissipation, making the heat conduction through disc/wheel carrier interface very desirable. These boundary conditions lower disc surface temperature and increase brake performance and life, as researched by Voller [1] and Tirovic and Voller [2]. However, at the disc/wheel bearing contact surface (Fig. 1), the heat transfer must be minimised, in order to prevent bearing overheating and possible failure.
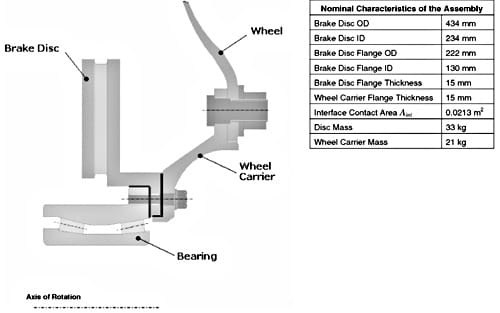
Fig. 1. Cross section and wheel assembly characteristics.
It is apparent that the disc/wheel carrier interface condition will vary throughout the life of the vehicle. In this research, experimental and theoretical studies have been performed to determine bolt clamp force, interface pressure distribution and TCR variations with pressure, temperature and interface condition. The ultimate aim was to establish a procedure for reliably predicting TCR, which will enable heat flow calculations through bolted joints in a variety of engineering applications, not restricting the findings to the considered automotive assembly.
2. Published TCR studies
Greenwood and Williamson [3] proposed one of the first models to predict contact area known as the GW model, which can be summarised as an elastic micro-contact model. The GW model has been modified by McCool [4] using a random process model of rough surfaces. The modified version of the GW model has been applied by McWaid and Marschall [5] to predict TCR and results compare well with experimental data. The GW model does not take into account the presence of surface films, which may take the form of natural oxidisation, liquid, powder, foil or plating. Research in the area of oxidisation has been summarised by Madhusudana and Fletcher [6]. A generally accepted conclusion is that oxide films, unless sufficiently thick, do not appreciably increase the TCR. Mian et al. [7] have shown experimentally that TCR increases with the film thickness and the ratio of the total film thickness to the mean surface roughness. TCR was found to decrease with the increased loading and the mean surface roughness.
To decrease the TCR, the air within interstitial areas at the contact interface can be replaced with a medium of higher conductance. Interstitial fillers may take the form of grease, metal foil, wire screens or powders. Indium foil and silicon grease appear to be the best materials in this category [6]. It has been shown that thermal conductance (the reciprocal of TCR) can be increased up to a factor of seven, by inserting a metallic foil at the interface [8]. Reduction of TCR by metallic coatings has been analysed by Antonetti and Yovanovich [9]. It was found that a silver layer can reduce the TCR of nominally flat, rough, contacting nickel specimens by as much as an order of magnitude; and that for a given layer thickness, the smoother the bare contacting surface the greater the enhancement will be.
Published brake thermal analyses deal with conductive heat dissipation inadequately. Since the contribution of this mode to the brake cooling is, in most service conditions, lower than convective and radiative heat dissipation, the contribution of conductive cooling is either neglected or oversimplified. Morgan and Dennis [10] found that conduction coefficients are extremely variable for the theoretical prediction of brake temperatures. Cetinkale and Fishenden [11] suggested that the contact coefficient is likely to change dramatically with time or with subsequent dismantling and reassembly during servicing. Sheridan et al. [12] modelled the conductive heat transfer that exists between the disc flange and the hub and wheel by doubling the convective heat transfer coefficients used on the disc friction surfaces (a value of 200 W/m2 K). An even more simplified approach was taken by D’Cruz [13] with the use of a ‘blanket’ heat transfer coefficient of 100 W/m2 K to all disc free surfaces. In order to determine conductive heat transfer from a disc brake, Fukano and Matsui [14] changed the apparent rate of heat transfer from the disc to the hub until calculated temperatures became ‘identical’ with experimental values. The best mat
ch was achieved for the thermal contact conductance of 712 W/m2 K. This value is certainly adequate for the particular vehicle and test conditions but does not represent a ‘universal’ value.
3. Analysis of interface conditions
The value of TCR at the interface between two mating surfaces depends on the surface roughness, material properties, temperature and pressure at the interface, and the type of interstitial medium. In general, TCR will increase with increased surface roughness and material hardness and reduce with interface pressure.
In the case of the considered assembly, the interstitial medium is air, with possible wetting (water, including road film, salt, snow, etc.) causing moisture penetration. The brake component materials and their mechanical and thermal properties are defined by component function; grey cast iron for the disc and spheroidal graphite (SG) cast iron for the wheel carrier. Material properties of these components cannot be altered in order to influence TCR. Furthermore, surface finish is determined by the manufacturing methods (face turning), having typical Ra values between 1 and 3.3 μm, see Table 1. The achievement of lower surface roughness is not feasible due to high associated costs.

Table 1. Brake assembly interface surface finish
During initial assembly, the component’s contact surfaces are corrosion free and it is apparent that the disc/ wheel carrier interface condition, and therefore TCR, will vary through out the life of the vehicle. This is mainly due to moisture penetration and corrosion development at the disc/wheel carrier interface. The ‘typical’ wheel carrier interface condition found in service, for most of the life of the vehicle, is shown in Fig. 2a, a newly machined surface is shown in Fig. 2b. As the components are bolted together, separation is possible for repair and maintenance. However, this is not normally expected for at least 6 years of vehicle operation. The main reasons for joint separation would be disc and/or bearing replacement. Obviously, such an activity would ‘disturb’ the interface and cause a change in the TCR.

Fig. 2. Interface conditions: (a) corroded, (b) new machined, and (c) aluminium foil gasket.
The above two conditions, considering new and slightly corroded components, represent most bolted joints exposed to the outside elements. In order to study the possibilities of reducing TCR to increase the conductive heat transfer (and therefore improve brake cooling), two methods have been tested on the slightly corroded ‘typical’ interface condition.
The first method of interface conditioning was the insertion of a thin aluminium foil ‘gasket’ at the interface, see Fig. 2c. Aluminium has a high thermal conductivity and is very soft, providing good contact at the interface. The foil used in the tests was 15 μm thick, standard 99.5% aluminium foil (see Table 2).
![Table 2. Aluminium gasket properties (at 100 °C) [8].](https://www.sensorprod.com/wp-content/uploads/2023/08/table02-2.jpg)
Table 2. Aluminium gasket properties (at 100 °C) [8].
The second method of interface conditioning was the use of a high thermal conductivity paste, which has the added benefit of easy application by brush or spray (an advantage in the vehicle servicing environment). The manufacture’s specification is shown below in Table 3, unfortunately specific heat and density values were not available.

Table 3. Technical specification of heat sink compound.
The heat sink compound used is a two metal oxide filled paste of high thermal conductivity, approximately 35 times higher than air at 20 °C. The paste is commonly used to improve heat transfer between semiconductor devices and heat sinks.
Both methods are considered practically applicable in an industrial environment, in particular the application of the paste. To determine the feasibility of the conditioning method, the actual gains in heat dissipation must be justified with associated costs.
4. Investigation of interface pressure distribution
The brake assembly is fastened together using ten 12.9 grade high tensile alloy steel M16 bolts (see Figs. 1 and 2), tightened to the nominal torque of 300 N m. The experimental investigations confirmed a linear relationship between the bolt tightening torque and clamp force. For the nominal torque, individual bolt clamping force was 120 kN, giving an average interface pressure of 56.2 MPa.
Interface pressure distributions have been studied theoretically, using finite element modelling and experimentally, using pressure sensitive paper. For illustration purposes, Fig. 3 shows the Pressurex pressure sensitive paper used (Sensor Products Inc.), after being clamped between the disc and the wheel carrier. Due to large variations in pressure, two grades of paper were used, High grade (measures pressures from 49.0 to 127.6 MPa) and Medium grade (measures pressures from 9.7 to 49.0 MPa). The change in colour of the initially white pressure sensitive paper to the shades of red is directly proportional to the pressure applied.
It can be clearly seen that the pressure is higher in the proximity of the fixing bolts, and reduces with increased distance from the bolts (note two smaller jacking holes diametrically opposed). After conducting the experiments, the pressure paper samples were sent to the manufacturer for processing. The results were processed in different forms (2D contour plots, line plots, 3D contour plots, and histograms) giving detailed information about the pressure distribution on the interface.
It is very important to emphasise that practically identical results were obtained using FE modelling, with adequate interface modelling (using gap elements) [15]. Obviously, the advantage of FE modelling is the possibility of designing new joints and predicting pressure distributions. For the considered bolted joint, FE analyses and pressure sensitive paper measurements (see Fig. 3) indicated two specific areas, area 1 in the proximity of the bolts with high pressure (approx. 101 MPa), and area 2 between the bolts, with a much lower pressure of approximately 35 MPa.
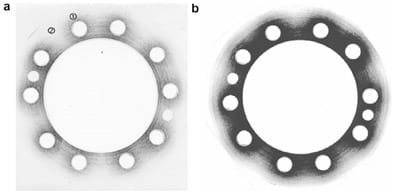
Fig. 3. High (a) and medium (b) pressure sensitive paper after pressure application at 300 N m bolt torque.
5. Measurement of TCRM
5.1 Experimental set-up
Experiments have been conducted on the CV vehicle brake disc and wheel carrier assembly (see Fig. 1) installed onto the Spin Rig (dedicated equipment for studying brake cooling characteristics). Fig. 4 shows the experimental setup. The brake disc and wheel carrier assembly had a slightly corroded ‘typical’ interface condition. The disc was heated using electric air heaters, enabling the regulation of the heating power between 0 and 4 kW. To ensure uniform heating, a special heater box was designed and used, and the components were insulated as shown in Fig. 4.
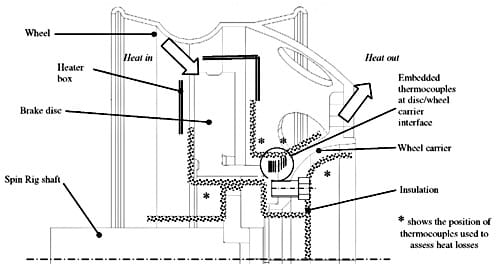
Fig. 4. Experimental set-up for measuring thermal contact resistance.
Pressure distribution investigations indicated two distinctive areas; high pressure around the bolts, and low pressure between the bolts (see Fig. 3). Therefore, holes have been drilled into the disc and carrier in these two areas as shown in Fig. 5 and correspond to positions 1 and 1. The holes were positioned with a bilateral tolerance of 0.1 mm and sized to allow secure fitting of the thermocouples. K-type welded tip glass fibre insulated thermocouples are used. For each area investigated, the thermocouples measured the temperature gradient at eight points across the interface of the two components (disc and carrier, see Fig. 4). Heat sink compound was applied to the bottom of the drilled holes to improve the contact with the thermocouple tip. Measurements were taken when steady-state conditions were reached, allowing the thermocouple tip to reach the same temperature as the surrounding material. The thermocouple hole depth was as close to the centre of the components as possible, this was to ensure that only conductive heat flow was measured and not heat flow to the surface, generated by any possible (despite insulation) convective or radiative heat loss. Further thermocouples were installed and experiments conducted in order to determine heat losses. In the worst test conditions, for the interface temperature of approx. 170 °C, the heat losses are estimated to be below 5%.
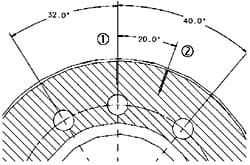
Fig. 5. Angular position of drilled holes for embedded thermocouples (in degrees).
5.2. Experimental procedure
The standard CV brake disc and wheel carrier are bolted together as shown in Fig. 4. A specific procedure of tightening bolts was established in order to obtain consistent results. The bolts were tightened first to 50 N m, opposing bolts being tightened alternately to avoid high pressure concentration. The assembly was heated until steady-state conditions were achieved. By controlling the heater power, three temperature levels were achieved at the interface, in the regions of approximately, 70, 120 and 170 °C. The 8 thermocouple temperatures were logged during a typical heating cycle at each position (1 and 2). The criteria for reaching steady-state condition was set as a temperature change of less than 1.0 °C during 400 s.
The assembly was then cooled down to approximately room temperature (within 1 °C). Bolts were tightened to the higher torque, in 50 N m increments, and the heating (and data logging) process repeated. It is assumed that thermal stresses and deflection generated across the three components (brake disc, wheel carrier and bolts) have insignificant influence on pressure distribution. It must be noted that reference interface pressure at room temperature was used in all analyses and derived formulae. The maximum measured temperature variation is typically 15 °C across the bolted flanges, having total thickness of 30 mm. The thermal expansion coefficients for the grey iron disc, SG iron wheel carrier and steel bolts are very similar (but still somewhat different). Steady state conditions were examined, allowing quite uniform heating of the components, all manufactured from metals of relatively high thermal conductivity. There is no doubt that thermal gradient will influence the interface pressure distribution, despite all the effects mentioned before and the high ‘stiffness’ of the bolted joint. This effect will be discussed in more detail later, with other influencing factors and uncertainty analysis.
It must be noted here that one measurement for each test condition (pressure and temperature) was conducted, which makes the experiments single-sample type. In the process of developing the procedures presented in this paper, a number of measurements were repeated, ensuring good repeatability and building confidence in developed methodology. However, the testing is very time consuming and for all measured conditions, under the imposed limitations, it was not possible to conduct multiple-sample experiments nor to vary some other parameters authors would have liked to experiment with (such as repeat the measurements when releasing the bolts in 50 N m increments).
Fig. 6 shows the average steady-state temperatures at the eight points (position 2) for the interface temperature of approximately 170 °C. The distance of the thermocouple measurement from the interface is plotted on the x-axis of the graph. The temperature gradients are proportional to the conductivity of the material and the steeper gradient of the carrier is a result of its lower conductivity. The predicted temperature drop at the interface is shown in Fig. 6 (ΔΤint equal to 2.3 K).
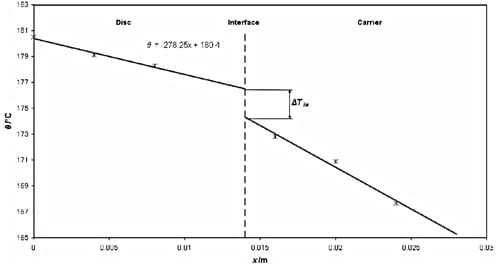
Fig. 6. Average temperatures at the modified CV disc/wheel carrier interface.
So far, the term ‘thermal contact resistance’ (Rcond[m2 K/W]) has been mainly used to describe the phenomenon of resistance to conductive heat transfer through the interface of two solid surfaces in contact. However, despite this term being most appropriate for describing the phenomenon, for actual calculations of conductive heat transfer, thermal contact conductance hcond [W/m2 K], is often more suitable. Thermal contact conductance is the reciprocal value of the TCR coefficient (hcond = 1/Rcond). The average thermal contact conductance (hcond ) at the interface can be determined from the heat transfer equation:

where Qcond is conductive heat transfer through the interface, Aint is the contact area, ΔΤint temperature difference at the interface, between the disc and carrier surfaces:
It is assumed that there are no heat losses in the proximity of the interface (again, this will be discussed later) and all the heat (Qcond) is conducted from the disc to the wheel carrier. The heat flow is determined by Fourier’s law of heat conduction:

where kD is disc material thermal conductivity, and thermal gradient dT / dx is already known from Fig. 6 (dT / dx = -278.25 K/m). It should be noted that a corresponding equation can be established for the carrier, by including thermal conductivity of carrier material (kC ) and corresponding temperature gradient dT / di, with the interface area (Aint ) being identical for both components.
6. The influence of interface pressure and temperature on TCR
Numerous experiments have been conducted to examine the change in hcond with contact pressure and temperature. As explained above, the fixing bolts were tightened to six torque levels (all bolts to the same torque) gradually increased from 50 to 300 N m, in 50 N m increments. Fig. 7 shows hcond</sub > values at the two positions (at bolt 1 and between bolts 2), for 6 average pressures (bolt torques), at the three interface temperatures. The results indicate that the intercept at zero average interface pressure is equal for all the measurements. This is a good indication of the validity of the approach and measurements, since at zero average pressure (component only ‘gently’ brought into contact) there will be no difference in the pressure across the interface area (for nominally flat contact surfaces).
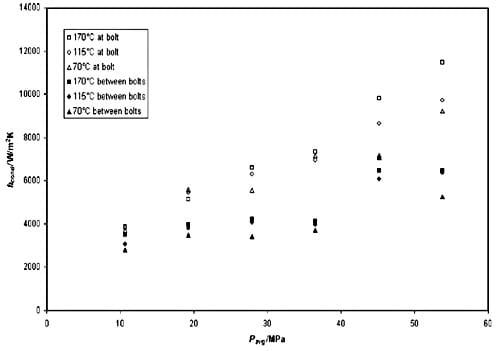
Fig. 7. Thermal contact conductance at the standard CV disc/carrier interface.
Fig. 8 shows hcond values at the two positions (at bolt 1 and between bolts 2), for the three interface temperatures, at the nominal interface pressure (at a 300 N m bolt torque). The data is quite limited and assuming the interface pressure distribution remains unaffected with the temperature increase (the assumption already mentioned, which will be further discussed later), the relationship indicates slight linear increase of hcond with temperature.
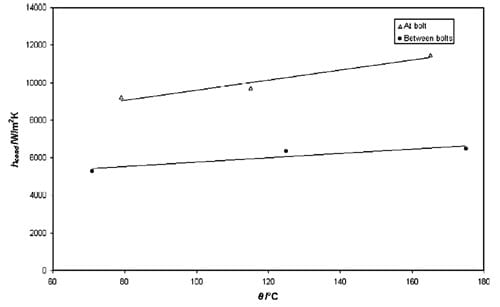
Fig. 8. Thermal contact conductance at the standard
CV disc/carrier interface, change with temperature.
It can be seen from Figs. 7 and 8 that hcond ranges from 2800 to 11,400 W/m2 K, increasing with the increase in contact pressure and temperature. There is some scatter but the trend is a linear increase with both average pressure and temperature. Figs. 7 and 8 also indicate that hcond is higher in the proximity of the bolts (position 1) than between the bolts (position 2). This is seen throughout the pressure range and corresponds to the increase in interface pressure in that region. Increase of thermal conductance hcond with temperature, as indicated in Fig. 8, is relatively small but consistent within the temperature range investigated. The increase of hcond is most probably due to higher radiative heat transfer within the interstitial volumes (filled with air) between the two surfaces (components) in contact. The surfaces are very close and even small increases in temperature may well influence radiative heat transfer. However, it is unlikely that such a small difference in the temperature range would significantly influence conductive heat transfer between the asperities in contact. Obviously, further work both on the micro and macro scale is required to investigate the influence of the temperature in more detail. Some further comments will be given in discussions.
Using the data shown in Figs. 7 and 8 and the detailed information about local interface pressure from Section 4 (see also Fig. 3), it is possible to calculate hcond as a function of local pressure and temperature:
where P is local interface pressure in MPa and Ф is ‘nominal’ interface temperature in °C. Since, at the interface, the difference between the temperatures of the two components (disc and carrier) is relatively small (of the order of only several °C), the nominal interface temperature can be assumed to be equal to the mean value of the interface temperatures of the two components in contact:
The linear relationship in Eq. (4) is justified assuming no change of interface pressure with temperature (no influence of thermal stresses and deflections, which will be discussed later), and can be used to calculate average thermal conductance (hcond(avg)) for the entire bolted joint, based on average interface pressure (Pavg):
The average interface pressure can be calculated from the total bolt clamp force (F) and interface area:
The above procedure is fast and simple, therefore suitable for a variety of reliable engineering calculations. Fig. 9 shows the comparison between measured and predicted local thermal conductance (em>hcond) using Eq. (4). The results, assumptions and uncertainties will be discussed in more detail later.
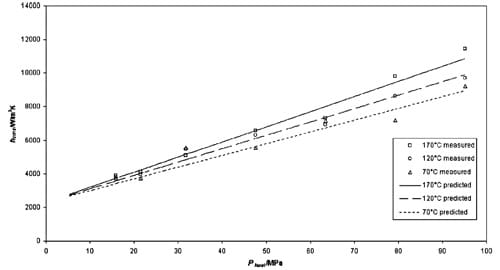
Fig. 9. Comparison of measured and predicted local thermal conductance.
7. The influence of corrosion and interface conditioning on TCR
As explained earlier, in order to reduce TCR, two methods have been investigated, the use of aluminium foil gasket (see Fig. 2c) and the application of a silicon heat sink compound at the interface. This was done for the slightly corroded surfaces, as expected for the majority of the life of the components in contact. As in previous cases, the measurements were taken at three temperatures, in the range of 70–170 °C, for a nominal bolt torque of 300 N m. Average hcond values have been used to compare the modification techniques with the two ‘initial’ interface conditions (new and corroded), as shown in Fig. 10.
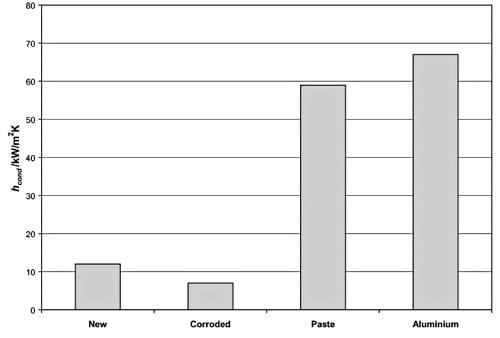
Fig. 10. Average hcond at the interface at the nominal bolt torque.
The average hcond values range from 7 to 67 kW/m2 K. The new joint has an average hcond value of 12 kW/m2 K. This value is in good general agreement with the limited data published. Due to corrosion, thermal conductance is reduced to only 7 kW/m2 K. However, the use of heat sink compound paste increases conductance to 59 kW/m2 K. The use of aluminium foil provides the highest increase in hcond (approximately 10 times) with an average value of 67 kW/m2 K. These two practical and inexpensive methods increase the thermal conductance very dramatically. At the same time, it is very likely that such high conductance will remain throughout the lives of components. In the experiments conducted, the interfaces were corroded, and both methods provide a seal preventing any deterioration of the contact conditions. Applications on new components are expected to achieve even higher conductance.
8. Discussion and uncertainty analysis
In the presentation so far some of the factors influencing the measurement results and ultimately thermal conductance (hcond ) have been mentioned but not discussed in detail. In order to address these and other factors influencing the uncertainties related to the measurements, the source of errors are summarised in Table 4. This may also help in deciding the application of the de
rived formulae to other joints. The list is not complete but all important sources of error have been included, they have been classified as five broad groups for reasons of clarity.

Table 4. Sources of error.
It should be noted that some sources of error vary relatively little, some have a minor influence on the results (such as hcond) whilst the variation and uncertainties related to others are much higher. Obviously, the important factor is how much these variations influence the actual results and/or predictions. The sources of error should be also looked at in two different ways: firstly, the effect and influences in the conducted measurements and formulae derivations (presented in this paper), and secondly the effects and influences when applying these formulae to other (however similar) designs.
Including all parameters in the uncertainty analysis would be very complex task, in particular since identical components were used, all components were dimensionally and geometrically accurately measured, the assembly procedure (tightening and positioning of bolts) carefully controlled and temperature increase was relatively low. The sources of error considered particularly important were disc thermal conductivity and temperature measurements, related to the thermocouple signal and data logging errors. These three influencing factors have been marked in bold italic in Table 4.
Grey cast iron thermal conductivity can vary quite substantially (see [16,17]) and its influence is direct and substantial (see Eq. (3)) on measured results. However throughout the tests, the same components were used and no change in these properties can be expected, since the achieved temperatures were relatively low. Obviously, some variation with temperature is inevitable. The particular problem with this property is that its measurement is very expensive and different procedures often give somewhat different results. This is one of the most important properties for brake disc materials but, for the very reasons explained, is (usually) not specified by brake manufacturers, neither on documentations nor used for quality control purposes. This property is controlled indirectly, by specifying chemical composition, microstructure and manufacturing processes (casting, heat treatment etc.). Such an approach ensures consistent thermal, mechanical, friction and wear properties. Numerous other thermal analyses and measurements were conducted with this type of disc and the authors are confident that the value used is very close to the ‘true value’. The uncertainty analyses were conducted for two values of uncertainties of disc thermal conductivity (kD), ±2% and ±5%, considered to be realistic variation of this property.
Temperature measurements are crucial for the conducted experiments, directly influencing the results (Eqs. (1)–(3)). For uncertainty analysis, the thermocouple signal errors will be given a wider ‘meaning’ and will also include the ‘procedure effects’ related with the disturbance of heat flow by temperature measurements and thermal contact resistance at the thermocouple tip (marked in italic in Table 4). The uncertainties related to the thermocouple signal error are difficult to realistically estimate. Two values, assuming thermocouple signal error of ±0.1 °C and ±0.2 °C were used. It is considered, in particular since measurements were conducted for steady state conditions, that the first quoted value (±0.1 °C) is more realistic. It must be noted here that actual thermocouple signal errors are much smaller but the ‘allowance’ was made for influences of disturbance to heat transfer due to thermocouple installation and thermal contact resistance of the thermocouple tip.
Data logger errors are taken from detailed manufacturer’s specification. The equipment used is the RS Datascan 2200 data acquisition system, with an onboard processor. The uncertainty in temperature measurement due to data logger errors is ±0.011 °C, which is of the order of the magnitude lower than the estimated thermocouple signal error.
Following the previous considerations the effects of the uncertainties described were analyzed using the uncertainty approach explained in [18]. Uhcond (the uncertainty of hcond) can be calculated in Eq. (1), data logging and thermocouple measurement uncertainty directly gives estimates for UTD and UTC (uncertainties in TD and TC at the interface). The UAint (uncertainty in Aint) is neglected as ultimately the method of calculating hcond using Eq. (3) zeros Aint out.

The calculation of UQcond (the uncertainty of Qcond), used in Eq. (8), involves the uncertainty in the Fourier law equation applied in the direction across the interface, calculated in Eq. (3). Material thermal conductivity uncertainty directly gives a value for UkD, (uncertainty in KD). Giving a final expression for UQcond :

where Udx / dT (the uncertainty of dx / dT), neglecting Udx, is assumed to be:

Uncertainty analysis was carried out for randomly selected sets of experimental data and the results can be considered as an overall value for data shown in Figs. 7–9. The results are summarised in Table 5. The authors have confidence in the first result, indicating around 10% uncertainty in the calculated thermal conductance (hcond) at the interface. It must be noted here that thermal contact resistance is a complex phenomenon and the research is conducted at ‘bulk’ level, aiming at establishing global relationships.
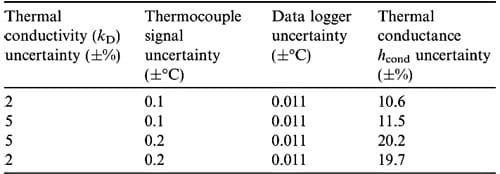
Table 5. Uncertainty predictions.
When uncertainty in disc material thermal conductivity is increased from 2% to 5%, the influence on the ultimate result hcond is very low, under 1%. However, the increase in the thermocouple signal error, from 0.1 °C to 0.2 °C practically doubles the uncertainty of the thermal conductance (hcond ) to 20%. Reduction of thermal conductivity uncertainty has practically no effect. These calculations were performed only for illustration purposes, clearly demonstrating crucial importance of accurate temperature measurements.
5. Conclusions
Conduction has been the least studied mode of heat transfer in the past. Published work dealing with brake thermal modelling takes a simplified approach to conductive heat dissipation, applying general heat transfer coefficients to brake areas conducting heat.
The work presented here clearly demonstrates that reliable predictions of thermal conductance can be made. Simple relationships relate interface pressure (local or global) and temperature to thermal conductance at the interface. The influence of interface pressure on thermal conductance is particularly pronoun
ced. The interface pressure can be reliably theoretically predicted (using FEA) or measured (using pressure sensitive paper). Due to the much lower influence of temperature (compared to interface pressure) on thermal conductance, reasonable temperature estimation is sufficient for accurate calculations of heat transfer through a variety of bolted joints, at either local or global level.
It has been shown that corrosion approximately halves thermal conductance. The use of high thermal conductivity paste or a thin aluminium gasket at the interface has shown that very substantial improvements in the conductive heat transfer coefficient can be achieved. The increase is practically of the order of magnitude and likely to remain so throughout the life of the components.
The phenomenon studied in this paper is not limited to friction brake heat dissipation analysis; the thermal contact resistance results can be applied to similar multi-solid applications for accurate theoretical prediction of conductive heat transfer across a variety of bolted joints. Obviously, the joint behaviour with increase in temperature should be carefully examined, since high interface thermal contact resistance (low hcond), ‘flexible joints’ (subject to large variations in interface pressure due to thermal stresses and deflections) and/or large thermal gradients may substantially influence interface pressure and therefore thermal conductivity across the bolted joint.
It must be taken into consideration that the thermal contact resistance of the bolted joint remains a very complex phenomenon and derived equations should be only applied to suitable designs and with adequate care. Discussion of results and uncertainty analyses gave useful further insight into the associated sources of error and their influence on results obtained.
Acknowledgement
The work presented in this paper was made possible by the assistance obtained from the EPSRC (Engineering and Physical Sciences Research Council), ArvinMeritor (UK) and Brunel University, Department of Mechanical Engineering. The authors are grateful for this help.
REFERENCES
- G.P. Voller, Analysis of heat dissipation from railway and automotive friction brakes, PhD Thesis, Bunel University, UK, 2003.
- M. Tirovic, G. Voller, Optimisation of heat dissipation from commercial vehicle brakes, in: Fisita 2002 Conference, Helsinki, Finland, 2002.
- J.A. Greenwood, J.B.P. Williamson, Contact of nominally flat surfaces, Proc. R. Soc. Lond. A295 (1966) 300–319.
- J. McCool, Comparison of models for the contact of rough surfaces, Wear 107 (1986) 37–60.
- T. McWaid, E. Marshall, Application of the modified Greenwood and Williams contact model for the prediction of thermal contact resistance, Wear 152 (1992) 263–277.
- C.V. Madhusudana, L.S. Fletcher, Contact heat transfer – the last decade, AIAA 24 (1986) 510–523.
- M.N. Mian, F.R. Al-Astrababi, et al., Thermal resistance of pressed contacts between steel surfaces: influences of oxide films, J. Mech. Eng. Sci. 21 (3) (1979).
- Y.A. C¸ engel, Heat Transfer: A Practical Approach, WCR/McGraw-Hill, 1998.
- V.W. Antonetti, M.M. Yovanovich, Enhancement of thermal contact conductance by metallic coatings: theory and experiment, ASME – J. Heat Transfer 107 (1985).
- S. Morgan, R.W. Dennis, A theoretical prediction of brake temperatures and a comparison with experimental data, SAE 720090, 1972.
- T.N. Centinkale, M. Fishenden, in: Proceedings of the General Discussion on Heat Transfer, IME, London, 1951.
- D.C. Sheridan, J.A. Kutchey, F. Samie, Approaches to the thermal modelling of disc brakes, SAE 880256., 1988.
- A.H. D’Cruz, Surface crack initiation in ventilated disc brakes under transient thermal loading, Proc. Instn. Mech. Engrs., C328/053., 1989.
- A. Fukano, H. Matsui, Development of the disc-brake design method using computer simulation of heat phenomena, SAE 860634., 1986.
- M. Tirovic, G. Voller, Interface pressure distributions and thermal contact resistance of a bolted joint, Proc. Royal Soc. A 461 (2005) 2339–2354.
- G.N.J. Gilbert, Engineering Data on Grey Cast Irons – SI units, BCIRA Alvechurch, Birmingham, 1977.
- R.L. Hecht, R.B. Dinwiddie, W.D. Porter, H. Wang, Thermal transport properties of grey cast irons, SAE Paper No. 962126, 1996.
- R.J. Moffat, Describing the uncertainties in experimental results, Exp. Thermal Fluid Sci. 1 (1988) 3–17.


