


An In Situ Method for Determination of Current Distribution in PEM Fuel Cells Applied to a Direct Methanol Fuel Cell
Matthew M. Mench*,z and C. Y. Wang*
Electrochemical Engine Center, and Department of Mechanical and Nuclear Engineering, The Pennsylvania State University, University Park, Pennsylvania 16802, USA
This paper describes and demonstrates a new method for determination of current density distribution in an operating polymer electrolyte membrane ~PEM! fuel cell. The technique is a modification of the current mapping technique that relies on an array of shunt resistors embedded within a current collecting plate. Standard, nonaltered membrane electrode assemblies are utilized with gas diffusion layers in direct contact with an electrically segmented current collector/flow field. Multiple current measurements are taken simultaneously, allowing transient distribution detection with a multichannel potentiostat. Both steady state and transient data are presented for an operating liquid fed direct methanol fuel cell. Cathode flooding is predicted, and shown to occur at relatively high cathode flow rates. This technique can contribute to knowledge and understanding of key phenomena including water management and species distribution in PEM fuel cells. © 2002 The Electrochemical Society. @DOI: 10.1149/1.1526108# All rights reserved.
The liquid-fed direct methanol fuel cell (DMFC) has received enormous interest, particularly for portable systems, because the DMFC requires less ancillary equipment and is therefore a more simplified system compared to H2 polymer electrolyte membrane fuel cells (H2 PEMFC). Several studies have examined the performance of DMFCs as a function of operating conditions.1-3 Other research has been conducted to observe two-phase flow distribution in the anode of a DMFC.4,5 One of the main limitations to DMFC performance is that of methanol crossover. Several groups have examined methanol uptake, transport, and oxidation.6-9 Other research is aimed at modeling the DMFC system.10-19 For additional details, Lamy et al.20 provides an excellent review of the DMFC system.
Despite this work, there remains much to be done before the DMFC system is fully understood. One clearly demonstrated problem is that of cathode flooding, which typically occurs unless high cathode stoichiometries are used. In the DMFC, cathode flooding can, to a great extent, determine overall cell performance..21,22 Water management in the DMFC is especially critical because anode water activity is near unity due to contact with liquid methanol solution. Thus, unlike gas-fed systems, no back diffusive flux of water from cathode to anode will occur. As a result, vaporization into dry cathode flow is the only pathway for removal of excess cathode-side water accumulation from electro-osmotic drag, oxygen reduction reaction (ORR), and diffusion.
One of the key challenges to the advanced understanding of all PEM fuel cell systems, including the DMFC, is the development of techniques to measure the current density distribution of an operating cell. Determination of the current density distribution is critical to understanding key phenomena including water management, CO poisoning, and species distribution effects. A few papers have discussed various methods for achieving this goal. Weiser et al.23 described a novel technique utilizing a magnetic loop array embedded in the current collector plate to measure two-dimensional current density distribution of a hydrogen PEMFC. The authors demonstrated their technique and showed that cell compression can drastically affect the local current density. Stumper et al.24 described and demonstrated three methods for the determination of current density distribution of a hydrogen PEMFC. First, the partial membrane electrode assembly ~MEA! technique involves either masking different areas or partially catalyzing segments of the MEA to determine local current density behavior by superposition. Second, the subcell technique involves isolating individual locations of catalyzed anode and opposing cathode from the main cell in order to measure the performance of the desired location.
In the final technique, referred to as current mapping, individual shunt resistors are located normal to an unmodified MEA surface, between the flow field and a buss plate. Voltage sensors passively determine the potential drop across each resistor and, through Ohms law, current distribution though the flow plate is determined. Cleghorn et al.25 at Los Alamos National Laboratory has implemented a printed circuit board approach for current density measurements using a segmented current collector, anode catalyst, and anode gas diffusion layer. The cathode was not segmented considering that, in most cases, the ORR is the limiting process. They showed current density distributions for a hydrogen PEMFC operating at high anode and cathode stoichiometry.
While each of the described methods for determination of current density has advantages, it is desirable to utilize a nonsegmented MEA in order to preserve true fuel cell operation characteristics and avoid highly individualized specialty membranes. In addition to use of conventional MEAs and good spatial resolution, the ability to determine transient effects from sudden changes in operating conditions is desired. The nonsegmented passive current mapping technique approach of Stumper et al.24 allows for transient measurement and good spatial resolution, but requires a vast array of embedded and highly precise shunt resistors. The novel magnetic loop method of Weiser et al.23 also allows transient measurements with unaltered MEAs and flow fields, but is more difficult to implement than the other methods and cannot be used in stacks.
The purpose of this paper is to describe and demonstrate a new technique for measurement of current density distribution in a PEMFC using a standard, nonsegmented MEA and a multichannel load bank. The functionality and usefulness of this approach is demonstrated on a direct methanol fuel cell system under cathode flooded and nonflooded conditions. This is the first attempt, to the authors knowledge, of such data for an operating DMFC.
Experimental
Schematically shown in Fig. 1, the test and control system permits accurate control of anode and cathode inlet flow rates, pressure, and relative humidity, as well as cell and inlet reactant temperatures. All lines leading to the fuel cell itself are heated to the fuel cell temperature, which is maintained with heating cartridges in concert with several Omega Engineering, Inc. model 8500 proportional integral differential controllers. The methanol/water solution is delivered from the fuel solution tank to the anode by back pressure from a nitrogen gas cylinder. Dry cathode oxidant ~simulated air mixture with 21% O2 , balance N2) is delivered from pressurized cylinders. Note that the inlet relative humidity of all cathode flows reported in this study is 0%, as cathode humidification is not needed for suitable DMFC performance. Besides transient measurements, data shown were monitored at each condition until steady state was achieved.

Figure 1. Schematic of the control system used for testing with 50 cm2 test cell.
Current density distribution measurements.The current density distribution method described in this paper is fundamentally similar, and essentially a modification of the passive current density mapping technique of Stumper et al.24 However, an electrically segmented flowfield/current collector replaces the separate array of shunt resistors normal to the MEA. The segmented flow field is in direct contact with the gas diffusion layer on the anode and cathode. This technique eliminates the challenge to reduce current spreading due to in-plane conductivity of the flowfield plates, noted by Stumper et al.24 Instead, a gold-plated, electrically segmented current collector is used, and repeatable current density measurement data can be obtained. In this active current density mapping technique, the potentiostat system maintains a constant voltage and the current sensors measure amperage emerging from each segmented current collector location, without the need for shunt resistors. It is important to note that this measures the true current density distribution of an operating cell, as it flows from the gas diffusion layer, not as it emerges from the catalyst layer. Although current spreading through the gas diffusion layer occurs, this is similar to the real operating system. Artificially segmenting MEAs disrupts the true current density distribution reaching the current collectors.

Figure 2. Schematic of the 50 cm2 instrumented transparent fuel cell with segmented gold plated current collector ribs and detailed diagnostic capabilities.
A schematic of the windowed stainless steel cell with segmented current collecting rib design is shown in Fig. 2. On the anode and cathode sides, twenty stainless steel, gold plated ribs with 2 mm wide landings are embedded in transparent polycarbonate blocks to form a single path serpentine flow channel. Total current collection area, including the area under the landings of both current-collecting ribs on the edge of the flow field, is 51.2 cm2. Each rib is welded to a stainless steel pin that is also gold plated, and is used for both current collection and potentiostat probe connection from the individual rib location. The flow field channels are 2 mm wide, and 2.4 mm deep. A Teflon gasket was used to provide proper sealing, and the entire assembly was leak tested to 3 atm pressure under water. In the anode side, manifolds are located at the top and bottom of the flow field, permitting testing in a parallel or serpentine configuration, although all data reported here are with the single-channel serpentine arrangement. In addition, discrete ports exist for on-line species extraction and analysis at nine locations along both the anode and cathode flow paths.
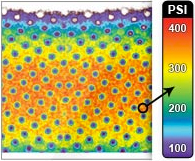
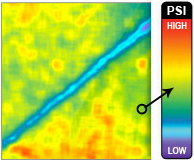
Gold plating, use of an optimized compression torque for the cell of 30 in-lb, and relatively large landing widths minimized electrical contact resistance between rib landings and the gas diffusion layer ~GDL!. Pressure indicating film ~Pressurex by SPI Inc.! was used to determine the in situ pressure distribution of the landings onto the MEA, as a function of compression torque. Additional machine work was done and the assembly rechecked to ensure a homogeneous pressure distribution from all landings onto the GDL, thus ensuring an even contact resistance distribution between the goldplated landings and GDL.
In order to demonstrate the effectiveness of this method, off the shelf 50 cm2 MEAs ~Lynntech Inc. of College Station, TX! were used in this study. Each MEA had a 4 mg/cm2 unsupported Pt/Ru anode catalyst loading with a 1:1 Pt/Ru atomic ratio and an unsupported 4 mg/cm2 platinum cathode loading. A carbon cloth anode gas diffusion layer and an ELAT carbon cloth cathode diffusion layer ~E-TEK, Inc., Natick, MA! was used with Nafion 117 membrane.
In order to measure the current density distribution in real time, ten of the current collecting rib segments were used to acquire data on a specialized, multichannel Arbin Instruments battery/fuel cell testing system. Because there are more current collection pins available from the fuel cell than could be recorded simultaneously by the multichannel potentiostat, some of the pins were bussed together to get average values for current density. To calculate the current density of a particular pin or set of bussed pins, the active area directly under the rib, and half of the adjacent gas channel, were taken. The reported location of the pin along the cathode flow path is the center of this total area, directly under the current collecting landing segment. Note that the segmentation of the vertically oriented ribs permits one-dimensional current density resolution in the direction perpendicular and in-plane to the current collectors. As previously discussed, current spreading through the gas diffusion layer due to in-plane conductivity is expected, as in a normally operating fuel cell, due to the nonsegmented nature of the backing and catalyst layers. Interestingly, however, this spreading is demonstrated to be minimal, both by the discrete nature of the output, and by the experimentally determined high in situ carbon cloth resistivity relative to current collecting landing electrical contact resistance.
A four-probe technique was used to determine the in situ in-plane GDL resistivity free of contact losses. While the fuel cell was fully assembled, 1 A of current was delivered from a rib contact at the cathode or anode inlet across the GDL to a rib contact pin at the opposite end of the flow field. Then, the voltage drop between various other pins not involved in current delivery was determined. These results were compared to similar testing with a two-probe technique that delivered current and measured voltage drop between two contact pins at several locations which necessarily included contact resistance losses between the GDL and the gold-plated rib landings. It should be noted, that due to the fact this measurement was made in situ, the backing layer was in contact with a catalyst layer of some in-plane conductivity. Thus, the measured conductivity may be lower than the actual intrinsic in-plane conductivity of the backing layer. However, it is representative of the actual in-plane electron flow resistance. Both ELAT and carbon cloth showed similar resistivity of ;0.012 V cm. The average measured contact resistance was 0.0025 V. Therefore, the in-plane ohmic drop through the GDL was sufficiently high relative to the rib landing contact resistance so that minimal crosstalk is expected.

Figure 3. Performance comparison of transparent segmented cell and titanium DMFC. Operating conditions: 1.0 M solution, temperature: 80°C, ja : 39 at 0.1 A/cm2, § : 85 at 0.1 A/cm2, anode exit pressure: 1 atm, cathode exit pressure: 2.04 atm. Both cells with 50 cm2 active area.
Results and Discussion
Although the wide, gold plated rib landings provide a low contact resistance, bulk performance of this cell is less than what can be achieved with noninstrumented cells. A comparison of a bulk polarization curve of the instrumented cell ~all channels bussed together! with a 50 cm2 titanium fuel cell ~Lynntech, Inc.! is shown in Fig. 3. It can be seen that the nonoptimized flow field configuration of the instrumented cell, compared to the titanium cell, which has six independent ~1.5 mm wide and 2.2 mm deep with a rib width of 0.85 mm! serpentine flow channels in parallel with each other, resulted in decreased performance. This is mainly attributable to the much wider landing area and single flow path used in the instrumented cell, and likely blockage of oxidizer to the cathode surface under the landings. The wide landings prevent oxygen diffusion to the catalyst surface as well as hinder liquid water removal from landing areas, blocking the active area from oxidizer.26 A second generation cell has since been designed and successfully operated that shows much improved performance with a more performance optimized landing area to channel area ratio.
Water management in the DMFC.The liquid-fed DMFC system is unique from gas-fed systems in that the direction of water diffusion is always toward the cathode, as the anode side is fully saturated with liquid water. At open circuit, diffusion from anode to cathode is the only mode of water transfer through the PEM. At sufficiently high current densities, electro-osmotic drag and the ORR can increase the water activity on the cathode side to near unity as well, greatly reducing the diffusion contribution. This simplifies determination of the limiting conditions of cathode flooding under operating conditions approaching the cathode flooding boundary.
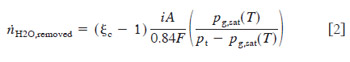
The water arrival and production at the cathode surface by diffusion,electro-osmotic drag, and hydraulic permeability can be expressed as where A is the active area, r is the molar water density, l is the membrane thickness, and K is the hydraulic permeability. For the modest pressure differences of typical DMFCs, this hydraulic permeability effect is nearly negligible, compared to electro-osmotic drag and ORR production. Other research has demonstrated that this effect is relatively small in terms of effective water transport.27 The electro-osmotic drag coefficient (ldrag) for a Nafion electrolyte in contact with liquid water at around 80°C is approximately 3.0.21 For the case where the cathode is just flooding, the diffusion to the cathode will be minimal. Thus, an estimate of the minimum amount of water that must be removed by the cathode to avoid flooding can be made by balancing Eq. 1 with the drying capability of the cathode flow. In reality, water will be absorbed near the inlet of the cathode more rapidly than near the exit, leading to some diffusion from anode to cathode, and the following will underestimate the required cathode flow rate. Assuming thermodynamic equilibrium, the maximum amount of water vapor that can be removed at the exit for an air cathode can be shown as


Figure 4. Plot of minimum stoichiometry requirements for flooding avoidance as a function of temperature and pressure of a DMFC with an air cathode.
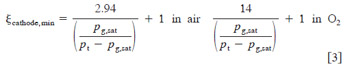
The factor of one in Eq. 3 is a result of the consumption of oxygen in the cathode by electrochemical oxygen reduction reaction. A plot of this minimum boundary as a function of pressure, over the relevant temperature range is shown in Fig. 4. It can be seen that, for most cases, the minimum cathode stoichiometry for a DMFC is determined by flooding avoidance rather than electrochemical requirements. For a temperature of 80°C, and a cathode pressure of 2.04 atm ~30 psig!, the minimum cathode stoichiometry to avoid flooding at the exit of a confined flow channel is nearly 18. However, if cathode pressure is reduced to atmospheric pressure, minimum stoichiometry requirements for water removal drop to 4, still much greater than needed for electrochemical reaction. Note that this prediction is a minimum, as local drying near the inlet section will likely induce diffusion of water from anode to cathode, and hence raise the overall flow requirement. Also note from Fig. 4 that the lowest curve is that of air at 3 atm pressure with no electroosmotic drag. For this curve, Eq. 3 was modified to eliminate the electro-osmotic drag term. This results in a vast reduction in the required cathode flow rate to avoid flooding. It can be seen from comparison of the two curves shown at 3 atm that the dominating mechanism promoting cathode flooding is electro-osmotic drag. Therefore, accuracy in the prediction of flooding is to a great extent determined by the expected value of electro-osmotic drag coefficient, ldrag .

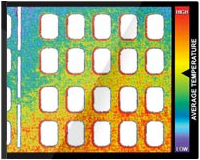
Figure 5. Current density distribution measured with high anode and cathode flow rates and 50 cm2 cell. For these high flow rate conditions, flooding is not expected to occur.
Current density distribution measurements.Unlike the hydrogen PEM fuel cell, the DMFC has extremely robust operation with respect to cathode flow rate. When the cathode flow rate is sufficiently high to mitigate flooding, additional increases in cathode flow rate result in little overall performance change, and a plateau is reached that can extend to very high cathode stoichiometry.28 This plateau occurs because additional water removal is readily replaced by diffusion from the anode to cathode, preventing extensive drying of the Nafion and performance loss. This feature is quite useful for control purposes, because it renders DMFC performance relatively insensitive to cathode flowrate above a critical threshold.
In order to directly observe the current density distribution in an operating DMFC fuel cell, the instrumented cell shown in Fig. 2 was used. To examine the current density distribution measured with this method, under what would be expected to be nearly homogeneous operating conditions, conditions of high anode and cathode stoichiometry were chosen. The cathode stoichiometry ~85 at 0.1 A/cm2) was high enough to avoid flooding concerns, by inspection of Fig. 4. A plot of current density with high anode and cathode flow rates, as a function of location along the cathode flow path, is shown in Fig. 5. Note that the fuel cell has a dual counterflow, single serpentine path orientation. Therefore, the inlet of the cathode will correspond to the exit of the anode, and visa versa. Data variations are within 0.03 A/cm2 at the same voltage throughout the cell, indicating nearly homogeneous distribution. Variations could be a result of slightly lower ionic conductivity of the inlet of the cathode resulting from flow of dry air. Additional variation could be a result of MEA catalyst layer inhomogeneity, contact resistance variation, local liquid condensate accumulation, or backing layer protrusion into flow channels. It is useful to note that in all cases, the entrance of the cathode seemed to be a lower performing section of the fuel cell. This is likely a result of some local PEM drying at this location.

Figure 6. Current density distribution measured with low anode and cathode flow rates and 50 cm2 cell. For these low flow rate conditions, flooding is predicted to occur. Operating conditions: 1.0 M solution, temperature: 80°C, §a : 27 at 0.1 A/cm2, §c : 5 at 0.1 A/cm2, anode exit pressure: 1 atm, cathode exit pressure: 2.04 atm.
A plot of current density distribution vs. location along the cathode path, measured with a low cathode flow rate ~cathode stoichiometry of 5 at 0.1 A/cm2) is shown in Fig. 6. For this low flow rate, flooding is expected, as can be determined by inspection of Fig. 3. Indeed, locations near the cathode exit produce little or no current, indicating flooded conditions. Assuming instant evaporation of all product water until saturation, the relative location along the cathode channel where flooding is expected to begin to occur can be shown as
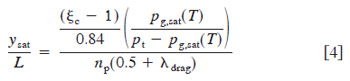
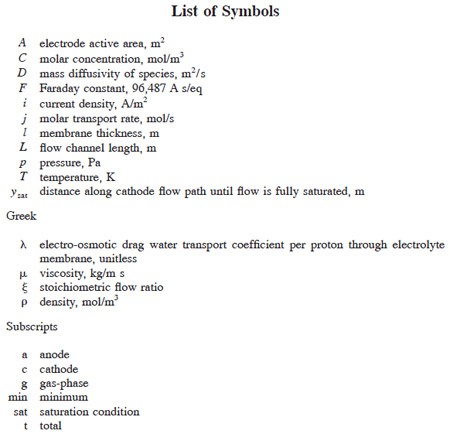
where np is the number of parallel paths of the same length in the cathode, and other symbols are defined in the List of Symbols. For the particular channel geometry of the cell used in this experiment and an electro-osmotic drag coefficient of 3.0, the above formula predicts saturation at a nondimensional cathode channel distance of around 0.25 at an average current density of 0.1 A/cm2, for the conditions shown in Fig. 6. This matches well with the experimental location of flooding, and confirms the current density distribution technique used is effective in discerning locations of low activity. The results indicate that the assumption of relatively little diffusion replacement interference in saturation processes is valid, within the range of error and variability of the other parameters used in calculation. Equation 4 assumes a linear water uptake into the vapor phase through the cathode flow channel, while the actual uptake will be proportional to the difference in local and saturation vapor pressure, and therefore asymptotic in nature. However, the resulting underprediction in the location of flooding onset appears to be compensated for by the overprediction of the onset of flooding location resulting from assuming no diffusion contribution. It should be noted that the predictions of Eq. 3 and 4 are to be used as guidelines only, and are not expected to be extremely precise due to the nature of the assumptions used in deriving them.
It is worthwhile to note that video microscopy of the cathode surface was also taken, and did show the emergence of liquid droplets at the gas diffusion layer/cathode channel interface at locations where flooding was indicated by current density measurement.22 Although these droplets emerged from the GDL at regular intervals when operating under flooded conditions, no real correlation could be obtained between the particular location of droplet emergence and current density output.
Figures 7-10 show polarization curves at discrete locations along the cathode serpentine path for incrementally decreasing cathode stoichiometry ~flow rate!. All other operational parameters remain the same. Data were recorded only after sufficient time period had passed until steady-state performance was observed. In Fig. 7, the cathode flow rate is high enough to avert flooding, and the individual polarization curves are bunched together. The cathode stoichiometry in Fig. 8 ~14.2 at 0.1 A/cm2) is high enough to avoid any major performance losses, although a mass-transport limitation, indicative of the onset of cathode GDL pore filling by liquid water, is evident over the last ;25% of the cathode flow channel. This is expected, since bulk performance is greater than 0.1 A/cm2 below 0.35 V. At this point, the true stoichiometry of the cathode flow relative to the operating current density will drop below 14, and consequently, flooding is expected by inspection of Fig. 4. Continuing with Fig. 9 and 10, it can be seen that severe performance limitations occur as the cathode stoichiometry dips below the threshold level predicted by Eq. 3. In both plots, comma shaped polarization curves are evident in locations near the cathode exit, and it is evident that water accumulation and pore filling in the cathode GDL plays an important role in DMFC performance at low cathode stoichiometry. The comma shaped curve can be understood by considering that as the average cell voltage is decreased, performance actually decreases at downstream locations in the cathode flow path because of additional upstream production and drag accumulation of water. That is, under high upstream current density conditions, downstream locations are more quickly flooded and perform poorly as a result of upstream water accumulation and evaporation.

Figure 7. Local polarization curve measured with high anode and cathode flow rate, significantly above the flooding limit. Operating conditions: 1.0 M solution, temperature: 80°C, §c : 85 at 0.1 A/cm2, §a : 27 at 0.1 A/cm2, anode exit pressure: 1 atm, cathode exit pressure: 2.04 atm.

Figure 8. Local polarization curve measured with high anode and cathode flow rate, at the flooding limit over a portion of the fuel cell. Operating conditions: 1.0 M solution, temperature: 80°C, §c : 14.2 at 0.1 A/cm2, §a : 27 at 0.1 A/cm2, anode exit pressure: 1 atm, cathode exit pressure: 2.04 atm.

Figure 9. Local polarization curve measured with high anode and cathode flow rate, below the flooding limit over a portion of the fuel cell. Operating conditions: 1.0 M solution, temperature: 80°C, §c : 7.1 at 0.1 A/cm2, §a: 27 at 0.1 A/cm2, anode exit pressure: 1 atm, cathode exit pressure: 2.04 atm.

Figure 10. Local polarization curve measured with high anode and cathode flow rate, below the flooding limit over a large portion of the fuel cell. Operating conditions: 1.0 M solution, temperature: 80°C, §c : 5.0 at 0.1 A/cm2, §a : 27 at 0.1 A/cm2, anode exit pressure: 1 atm, cathode exit pressure: 2.04 atm.
The average cell performance in Fig. 10 shows the classic masstransport limitation, i.e., a nearly vertical drop-off in performance. This comma shaped curve is characteristic of flooding and is similar in nature to that shown for local cathode flooding in a hydrogen fuel cell by Stumper et al.24
Interestingly, the cell performance distribution within the mass limiting performance portion of the average cell curve is highly variant. That is, despite the fact the average cell polarization curve reaches a maximum current density value from which it nearly vertically drops, the current density distribution within the cell is far from fixed within this mass limited voltage range. Instead, due to the high dependence of current density on flooding, as the cell voltage is lowered, the current density in the upstream, unflooded parts of the cell increases, while the current density in the flooded locations is reduced to nearly zero. The effect of decreased cell voltage is to shift the location of flooding to a more upstream region along the cathode path, while maintaining nearly the same overall cell current output at various cell voltages, resulting in the nearly vertical dropoff in the polarization curve seen for the bulk cell.
Transient performance and water accumulation leading to flooding can also be observed with the direct current density measurement method. Since all channels simultaneously record data, the performance response to a step change in input conditions can be directly observed. Figures 11 and 12 are examples of such output taken to show current density at discrete locations with varying cathode flow rate as a function of time. Only channels at locations 5.3, 15.8, and 100% across the horizontal distance of the cathode flowfield are shown for clarity. Other recorded locations follow the trends presented. In Fig. 11, the current density is shown with respect to time. As indicated on Fig. 11, the cathode flow rate is abruptly lowered at discrete time intervals. For the data shown in Fig. 11 and 12, the cell was maintained at 0.3 V. The lowest stoichiometry ~5 at 0.1 A/cm2 at the lowest flow rate shown! is adequate to provide ample oxygen for reaction, and the reduction in performance at this condition can be attributed almost solely to liquid water accumulation and pore blockage. The spikes associated with the performance during adjustment from higher to lower flow rate are attributed to flowmeter adjustment, not a fuel cell phenomenon.

Figure 11. Transient fuel cell performance as cathode flow rate is reduced. Operating conditions: 1.0 M solution, temperature: 80°C, §a: 27 at 0.1 A/cm2, anode exit pressure: 1 atm, cathode exit pressure: 1.34 atm.

Figure 12. Transient fuel cell performance as cathode flow rate is reduced at increased operating pressure. Operating conditions: 1.0 M solution, temperature: 80°C, §a : 27 at 0.1 A/cm2, anode exit pressure: 1 atm, cathode exit pressure: 2 atm.
In both Fig. 11 and 12, the channels closest to the cathode inlet ~channels 1 and 2 at locations 5.3 and 15.8% from the inlet, respectively!, show generally steady performance until the lowest flow rates, when even channel 2 begins to degrade, despite being upstream of the predicted location of flooding from Eq. 4. This may indicate local conditions in the GDL promote early flooding due to high local water vapor content and early saturation relative to gas channel values. It is also interesting to note that high flow rates can slightly dry the DMFC MEA on the cathode side, despite the additional mechanism of diffusional water replacement. Note that the level of performance of channel 1 and 2 increases as flow rate is decreased from 2.0 to 1.0 L/min in Fig. 11 and 3.2 to 1.0 L/min in Fig. 12, indicating performance was less than optimal at the highest flow rate conditions in both cases. For the low cathode pressure case shown in and Fig. 11, the improvement in channel 1 performance at the cathode inlet is enhanced almost 10% with decreased flow rate. Percentage increase in channel 2 performance is slightly less, indicating drying effects are more severe at the entrance, as anticipated. This may be the source of the relatively low performance of the upstream segments of Fig. 3 in the high cathode flow rate case.
Also note that the time scale of performance degradation is not instantaneous, and flooding occurs over a gradual time period. The data indicate that flooding blockage of pores accumulates at a rapid initial rate and then asymptotically approaches a final value. Initially, when few pores are blocked and performance is high, water generation results in fast degradation. As more pores are blocked and performance degrades, the rate of flooding accumulation decreases and a steady-state is reached. This rate of flooding degradation must be related to flow and material properties of the GDL. In addition, the initial condition of the GDL will influence the transient response to flooding. However, at this time, not enough data are available to put forth a suitable analytical expression to accurately describe this transient phenomenon as a function of all relevant parameters.
Similar to a result reported for hydrogen PEMFCs,29 liquid water accumulation, and transport is the slowest transport mechanism in the cathode, causing mass transfer limitations of oxygen to the cathode. For this wide-landing configuration, it is likely that severe pore blockage under the rib landings occurs, and contributes to the relatively low performance of the instrumented DMFC.
Conclusions
A new method for steady-state or transient determination of current density distribution of a nonsegmented MEA has been detailed, that is a modification of passive methods using shunt resistors to determine current flow through the bipolar plates. Performance data of an operating DMFC were shown to demonstrate its utility. Gradual flooding in the DMFC was shown to occur as a result of inadequate air supply to the cathode channel for water removal. The flooding phenomenon in DMFCs is predicted, and shown to generally occur at a cathode stoichiometry above that required for electrochemistry. The time scale of cathode flooding was shown to be quite slow relative to other transport and electrochemical phenomena. In addition, a slightly dry condition near the cathode inlet was demonstrated to exist at high cathode flow rate conditions. Because of the relative insensitivity of performance on other operating parameters, the key to achieving optimal DMFC performance appears to be optimizing water removal from the cathode for prevention of flooding.
Acknowledgments
The authors wish to gratefully acknowledge funding for this research from the Pennsylvania Department of Environmental Protection, The United States Department of Transportation Advanced Vehicle Program, and The Mid-Atlantic Regional Consortium for Advanced Vehicles ~MARCAV!. Andrew Hetrick and Joseph Scott assisted in laboratory testing for this project.
References
- K. Scott, W. M. Taama, and J. Cruickshank, J. Appl. Electrochem., 28, 289 ~1998!.
- X. Ren, P. Zelany, S. Thomas, J. Davey, and S. Gottesfeld, J. Power Sources, 86, 111 ~2000!.
- P. Argyropoulos, K. Scott, and W. M. Taama, Electrochim. Acta, 44, 3575 ~1999!.
- P. Argyropoulos, K. Scott, andW. M. Taama, J. Appl. Electrochem., 29, 661 ~1999!.
- X. Ren, T. Springer, T. Zawodzinski, and S. Gottesfeld, J. Electrochem. Soc., 147, 466 ~2000!.
- J.-T. Wang, S. Wasmus, and R. F. Savinell, J. Electrochem. Soc., 143, 1233, ~1996!.
- V. Tricoli, N. Carretta, and M. Bartolozzi, J. Electrochem. Soc., 147, 1286 ~2000!.
- W. Vielstich, V. Paganin, F. Lima, and E. Ticianelli, J. Electrochem. Soc., 148, A502 ~2001!.
- X. Ren, T. E. Springer, and S. Gottesfeld, J. Electrochem. Soc., 147, 92 ~2000!.
- Z. H. Wang and C. Y. Wang, in Direct Methanol Fuel Cells, S. Narayanan, T. Zawodzinski, and S. Gottesfeld, Editors, PV 2001-4, p. 286, The Electrochemical Society Proceedings Series, Pennington, NJ ~2001!.
- S. Baxter, V. Battaglia, and R. White, J. Electrochem. Soc., 146, 437 ~1999!.
- J. Wang and R. F. Savinell, in Electrode Materials and Processes for Energy Conversion and Storage, S. Srinivasan, D. D. Macdonald, and A. C. Khandkar, Editors, PV 94-23, p. 326, The Electrochemical Society Proceedings Series, Pennington, NJ ~1994!.
- A. A. Kulikovsky, J. Divisek, and A. A. Kornyshev, J. Electrochem. Soc., 147, 953 ~2000!.
- A. A. Kulikovsky, J. Appl. Electrochem., 30, 1005 ~2000!.
- H. Dohle, J. Divisek, and R. Jung, J. Power Sources, 86, 469 ~2000!.
- K. Scott, P. Argyropoulos, and K. Sundmacher, J. Electroanal. Chem., 477, 97 ~1999!.
- K. Sundmacher and K. Scott, Chem. Eng. Sci., 54, 2927 ~1999!.
- P. Argyropoulos, K. Scott, andW. M. Taama, J. Appl. Electrochem., 30, 899 ~2000!.
- K. Sundmacher, T. Schultz, S. Zhou, K. Scott, M. Ginkel, and E. D. Gilles, Chem. Eng. Sci., 56, 333 ~2001!.
- C. Lamy, J.-M. Le´ger, and S. Srinivasan, in Modern Aspects of Electrochemistry, J. OM. Bokris, R. E. White, and B. E. Conway, Editors, p. 53, Kluwer/Plenum Publishers, New York ~2001!.
- X. Ren and S. Gottesfeld, J. Electrochem. Soc., 148, A87 ~2001!.
- M. Mench, S. Boslet, S. Thynell, J. Scott, and C.Y. Wang, in Direct Methanol Fuel Cells, S. Narayanan, T. Zawodzinski, and S. Gottesfeld, Editors, PV 2001-4, p. 241, The Electrochemical Society Proceedings Series, Pennington, NJ ~2001!.
- C. Wieser, A. Helmbold, and E. Gu¨lzow, J. Appl. Electrochem., 30, 803 ~2000!.
- J. Stumper, S. Campell, D. Wilkinson, M. Johnson, and M. Davis, Electrochim. Acta, 43, 3773 ~1998!.
- S. Cleghorn, C. Derouin, M. Wilson, and S. Gottesfeld, J. Appl. Electrochem., 28, 663 ~1998!.
- A. C. West and T. F. Fuller, J. Appl. Electrochem., 26, 557 ~1996!.
- G. J. Janssen, J. Electrochem. Soc., 148, A1313 ~2001!.
- M. Mench, J. Scott, Z.-H. Wang, S. Boslet, S. Thynell, and C. Y. Wang, Abstract 315, The Electrochemical Society Meeting Abstracts, Vol. 2001-2, San Francisco, CA, Sept 2-7, 2001.
- D. Natarajan and T. V. Nguyen, J. Electrochem. Soc., 148, A1324 ~2001!.
