


Sterilization of Fuji pressure-sensitive film
A.B. Liggins, W.R. Hardie and J.B. Finlay
Orthopaedic Research Laboratory, University Hospital, University of Western Ontario, London, Ontario, Canada
Abstract
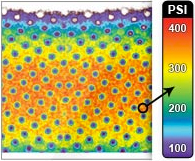
Fuji Prescale film is a pressure-sensitive medium which produces a characteristic pink stain on the application of pressure. Up to a saturation level, increases in pressure will produce a denser stain, thereby providing a method of determining pressures within the interface between two articulating surfaces. The relationship between the magnitude of applied pressure and the optical density of the resulting stain is non-linear; this relationship also varies with ambient temperature and humidity, in addition to load rate, and therefore requires a calibration procedure prior to use. The use of Fuji prescale film for recording interface pressures within the joint space in vitro has been widely reported; however, the object of this study was to assess the effects oj sterilizing this medium, with a view to juture in vivo applications. Samples of Fuji film were sterilized using a standard ethylene oxide (ETO) gas process and their subsequent pressurerecording properties were compared to a control group oj samples. The 'optical-density vs pressure' relationship for the sterilized group was significantly different from that of the control group (paired Student's t-test, P < = 0.001); however, both groups provided reliable data across the same pressure-range and both exhibited an excellent degree of repeatability (coefficient of variation <2.5%). It was concluded that Fujifilm will continue to produce pressure-stains following ETO sterilization; however, the calibration of this film will only be valid if it is conducted using film from the sterilized group.
Keywords: Keywords: Fuji film, pressure, sterilisation, joints
Introduction
Fuji Prescale pressure-sensitive film (Fuji Photo Co., Ltd, Tokyo, Japan) is being widely used in vitro for the recording of interface pressures within both physiological joints1-5 and within implants6-9. This film is supplied in four grades, designated as 'superlow', 'low', 'medium' and 'high', which together allow interface pressures between 0.5 and 130 MPa to be recorded. The first three grades offilm (super-low, low and medium) consist of an A-film and a C-film, both of which have an active coating on a polymer substrate. For its application, equal sized pieces of each film are placed into the interface under test, with their active surfaces in contact. On the A-film, the active coating consists of microscopic bubbles; these bubbles burst on the application of pressure, releasing an amount of colourless liquid which is dependent on the number of bubbles burst and is thus related to the pressure at a given location. The active layer on the C-film reacts with the liquid from the A-film, producing a pink stain. The 'high' grade film is currently supplied as a single sheet, consisting of a polymer substrate with an active layer consisting of both the bubbles and the colour-developing material. Since Fuji film is a uniplanar medium, placing it within a complex three-dimensional interface (i.g. between the articulating surfaces of a joint) will cause it to 'crinkle',3,8,10,11, thereby producing artifacts in the resulting presure stain. Two methods have been proposed to overcome this potential problem. The simplest method involves cutting the film such that it resembles a planar projection of the interface into which it is to be inserted8,1O. A more complex approach is to allow crinkle artifacts to be formed and then to remove these from a digitized image of the stain using a custom-written algorithm11.
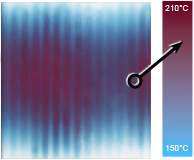
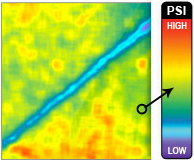
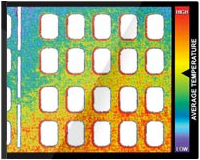
Within the working range of each grade of film, a greater pressure applied at any position on the film will produce a denser stain at that position; the corresponding optical stain-density value (which is dependent on the lighting conditions used to view the film) is determined by a grade-specific non-linear relationship. These relationships are temperature, humidity and load-rate dependent, necessitating a calibration procedure prior to obtaining stains from the interface of interest. Due to a number of limitations identified with the manufacturers' suggested protocol, a standard calibration and digital image capture and manipulation technique has been developed which presents results as false colour pressure-maps12. This technique has been used extensively for in vitro recording of interface pressures within total joint replacements8 ; however, the question has also been posed as to the possibility of sterilizing this medium for use in vivo, either within a patient, to investigate such factors as articulating surface integrity and prosthetic component alignment, or within an animal model, to conduct basic research on contact areas and pressures as they are affected inter alia by ligament integrity. Therefore, the objective of the work presented here was to evaluate Fuji film response and assess the validity of the calibration procedure following ethylene oxide (ETO) gas sterilization.
Materials and Methods
Eighty pieces, approximately 35 mm square, were cut from both A- and C-films of super-low grade (0.5- 2.5 MPa nominal range). Half of these pieces formed the control group and were stored in two envelopes, keeping the A- and C-films separate. The remaining pieces were packed for sterilization, again placing the film types in two separate packets, and ensuring that pressure could not be applied to the A-film during its handling in the sterilization process. This latter group were then subjected to the standard ETO process, as conducted at University Hospital; the film was placed in a sealed chamber, regulated for a temperature of 54°C, and subjected to a sterilization cycle consisting of the following phases:
Conditioning phase
The pressure in the chamber was reduced to -89.2 kPa, relative to atmospheric pressure. Steam was then injected into the chamber, increasing the relative humidity to 50%. The duration of this phase was 40min.
Sterilization phase
The chamber was then flooded for 105 min with a mixture of 12% ETO and 88% freon, up to a pressure of - 58.6 kPa, relative to atmospheric pressure.
Exhaust phase
The chamber was evacuated by reducing the pressure again to -89.2 kPa, relative to atmospheric. After 30 to 40 min, the majority of the gas mixture was considered to be exhausted; however, in the standard University Hospital cycle, this procedure was continued for a further 12 h, to ensure removal of any residual gases or moisture.
The two groups of calibration pieces were used III the following test protocols:
- A finely-ground 25 mm diameter hardened-steel punch, acting against a similarly finished baseplate was used to produce a series of standard circular calibration stains12; these stains were obtained from both control and sterilized film for 12 pressures between 0.25 and 3 MPa. At each pressure, stains were taken consecutively for control and sterilized film in order to reduce any effects on the response of the film due to fluctuations in ambient temperature and humidity; the latter were recorded during the production of each stain. After a 'development period' of 50 h12, the cali bra tion stains were digitized using a CCD video camera fitted with a fluorescent ring-lamp for illumination and a PCtype computer running Image Pro software (Media Cybernetics Inc., Silver Sring, MD 20910, USA). Each stain was analysed for mean reflective optical density and the resulting data used to produce graphs of pressure against pixel value (directly related to the reflective optical density) for the two groups of film; a fifth-order curve, with the associated 95% confidence limits, was then fitted to these data12 using SigmaPlot software Oandel Scientific, Corte Madera, CA 94925, USA). This procedure provided a qualitative comparison of the stain-response characteristics of both film-groups, across the complete valid pressure-range for super-low Fuji film.
- To test for repeatability of the two film groups and for any significant differences between the two, six standard calibrations stains for each group were obtained at each of four nominal pressures (0.5, 1.0, 1.75 and 2.5 MPa). A coefficient of variation test was used to test for repeatability between results in the same group at the same nominal pressure. An analysis for significant differences between the control and sterilized groups was conducted with a paired Student's t-test.
The active surfaces of unloaded samples of A-film from the control and sterilized groups were observed with an optical light microscope and a scanning electron microscope (SEM), in an attempt to observe any physical changes due to the sterilization process. The optically-viewed samples were taken directly from the experimental groups, with no further preparation; the SEM samples were sputter-coated under vacuum, with a nominal thickness of 30 nm of gold-palladium.
Results
The results from the standard calibration procedure, are presented in Figure 1; fifth-order curves and their corresponding 95% confidence limits have been fitted to both control and sterilized data. The upper and lower calibration limits (with regard to a 'working' pressure range) are also shown; these pass through the second and next-to-last datum points, thereby avoiding the artefactual 'curls' at the ends of the curves, which are produced as a consequence of using higher-order coefficients to obtain a better fit over the operating range. For these results, an ambient temperature of 25.2 ± 0.25°C and a relative humidity of 44 ± I % were recorded. It should be noted that within the Image Pro software, pixel value has an inverse relationship to the reflective optical density of the film, zero corresponding to 'black' and 255 corresponding to 'white'. Both the control and sterilized film produced a similar non-linear response, which has been described previously12. The noticeable difference between the two groups is that the sterilized samples registered a reduced sta in d ensit y (increased pixel value) for any given pressure. Alternatively, the same pixel value reading from the sterilized group will return a higher pressure value from the 'sterilized' calibration curve than from the curve for the 'control' samples. For example, in Figure I, a pixel value of 175 returns pressure values of 1.0 MPa and 1.3 MPa from the control and sterilized groups respectively. These figures represent an error of 23% if the control-group relationship were used to calibra te the sterilized film.

Figure 1 - The stain response of control group (.) and sterilized 'super-low' Fuji film
Table 1 gives the results of the second test protocol in the form of mean pixel value between the six samples in the same test group (control or sterilized) and nominal pressure, plus the coefficient of variation (COV) as determined from the percentage ratio of the standard deviation and the mean.
The paired Student's t-test showed a significant difference between the stain density responses of the control and sterilized groups at P < O.OO1. In addition, the low COY values < 2.5%) suggest an excellent degree of repeatability within both groups of samples, at all nominal pressures.
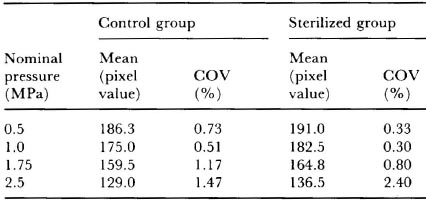
Table 1 - Mean pixel value and coefficient of variation in the second test protocol
Figures 2a and b show typical SEM images, taken from samples of A-film from the control- and sterilized-groups respectively; the larger bubbles in these images are in the order of 20 μ in diameter. It can be seen that there are no easily discernable qualitative differences between groups; both groups contain a similar number of bubbles over the sample area, with a similar number of these bubbles appearing to exhibit surface damage. This damage appears as discontinuities or 'dimples' in the spherical bubble surfaces and is probably due to the preparation procedure (vacuum and gold-palladium coating) required for SEM imaging; a noticeably larger number of damaged bubbles on the sterilized samples would have indicated that they were being ruptured during the sterilization process. The light microscope also indicated a similar distribution of bubbles on both control and sterilized film, thereby providing qualitative confirmation that this factor was not affected by either the sterilization or SEM preparation procedures; however, the lower magnification and depth of field provided by this instrument did not allow any bubble-damage to be observed.

Figure 2 - Typical SEM images of 'super-low' Fuji film , taken from a, the control group, and b, the sterilized group
Discussion
Sterilization of Fuji Prescale pressure-sensItive film using an ETO process has a significant effect on its response to interface pressure, producing stains of a lower reflective optical density, when compared to a control group. The treated film produces a calibration curve of a similar shape to the control group, with a high degree of repeatability. Therefore, it can be concluded that, while a separate calibration is required, sterilization of the Fuji film does not invalidate the calibration process. It might also be speculated from these results that, since the film survived the severe conditions of ETO sterilization, its use within other hostile environments could be considered for future applications.
While a qualitative comparison of SEM images from the control and sterilized groups was inconclusive, it is speculated that the reduced stain response of the sterilized film is possibly due, among other effects, to a reduced number of intact bubbles on the film or a hardening of their outer surface following the sterilization process.
The physiological effects of the liquid released by the A-film are not known; however it would be expected that the film would be sealed in some way to prevent fluid damage to it during in vivo use, in which case the sealing material would also serve to prevent any leakage of A-film liquids into the body. Sealing of the film has been described in the literature13 and we are currently investigating alternate sealing techniques.
With the provision of a suitable sealing material, Fuji film could be used in vivo to record both contact areas and pressures. The use of Fuji film to record contact areas is compromised by its lower pressure threshold; pressures below this threshold value do not induce a response from the film and consequently cause any stain to provide an underestimate of contact area - hence we have used super-low grade film for this purpose8. From our results (Figure 1) it can be envisaged that any differences in contact areas recorded by the control and sterilized filmgroups would probably be less than the errors incurred in estimating the edge of a contact area which contains a granular low-pressure response from the film8 . The use of Fuji film to record pressures requires loading of the joint under controlled conditions which match those used to produce the calibration data; this requirement may present a problem in the operating room. Two methods have been identified which could be used in this situation. The first method would require the development of a manual loading arrangement similar to that found on the KTlOOO knee laxitl testing device (Medmetric, San Diego, CA, USA)14; load iS applied via a handle and an audible indication IS given when the desired load is achieved.
Alternatively, it may be possible to stimulate the muscle-groups about the joint, either directly in a patient using surface electrodes15 or via excitation of the motor-control innervation in an animal model15,16; this approach would require an integration of the resulting pressure data to obtain a value for the load applied across the joint.
In conclusion, we have shown that it is possible to use Fuji film following an ETO sterilization process, although further work is required to facilitate its application in the operating room.
Acknowledgements
This work was funded by Medical Research Council of Canada grant number MA-11578, and The Arthritis Society of Canada grand number 93070.
References
- Brown TD, Pope DF, HaleJE, Buckwater JA, Brand RA. Effects of osteochondral defect size on cartilage contact stress. J Orthop Res 1991; 9: 559-67.
- Fukubayashi T, Kurosawa H. The contact area and pressure distribution pattern of the knee: A study of normal and osteoarthrotic knees. Acta Orthop Scand 1980; 51: 871-9.
- Haut RC. Contact presures in the patellofemoral joint during impact loading on the human flexed knee. J Orthop Res 1989; 7: 272-80.
- Hehne HJ, Ficker E, Jantz W, Mahr D, Schopf HJ. A new method for measurements of pressure distributions and contact areas in joints. Morphol Med 1981; 1: 95-106.
- Werner FW, Murphy DJ, Palmer AK. Pressures in the distal radioulnar joint: effect of surgical procedures used for Kienbock's disease. J Orthop Res 1989; 7: 445- 50.
- Collier JP, McNamara JL, Surprenant VA, Jensen RE, Surprenant HP. All-polyethylene patellar components are not the answer. Clin Orthop 1991; 273: 198-203.
- Collier JP, Mayor MB, McNamara JL, Surprenant VA, Jensen RE. Analysis of the failure of 122 polyethylene inserts from uncemented tibial knee components. Clin Orthop 1991; 273: 232-42.
- Liggins AB, Finlay JB. Recording contact areas and pressures in joint interfaces. In: Little EG, ed; Experimental Mechanics: Technology Transfer between High Tech Engineering and Biomechanics. Amsterdam: Elsevier Science Publishers, 1992, 71-88.
- Minns RJ. Wear and contact stress studies of the Minns meniscal knee prosthesis. Eng Med 1988; 17: 135-8.
- Afoke NYP, Byers PD, Hutton WC. Contact pressures in the human hip joint. J Bone Joint Surg [Br} 1987; 69B: 536-41.
- Caldwell NJ, Hale JE, Rudert JM, Brown TD. An algorithm for approximate crinkle artifact compensation in pressure-sensitive film recordings. J Biomech 1993; 26: 1001-9.
- Liggins AB, Stranart JCE, Finlay JB, Rorabeck CH. Calibration and manipulation of data from Fuji pressure-sensitive film. In: Little EG, ed; Experimental mechanics: Technology Transfer between High Tech Engineering and Biomechanics. Amsterdam: Elsevier Science Publishers, 1992, 61-70.
- Hale JE, Brown TD. Contact stress gradient detection limits of Pressensor film. J Biomech Eng 1992; 114: 352-7.
- Daniel DM, Malcolm LL, Losse G, Stone ML, Sachs R, Burks R. Instrumented measurement of anterior laxity of the knee. J Bone Joint Surg [Am} 1985; 67 A: 720-6.
- Crago P, Peckham PH, Mortimer JT, Van Der Meulen JP. The choice of pulse duration for chronic electrical stimulation via surface, nerve and intramuscular electrodes. Ann Biomed Eng 1974; 2: 252-64.
- Ronsky JL, Herzog W, Brown TD, Leonard T. In-vivo determination of patellofemoral joint contact pressures. (Abstract) J Biomech 1993; 26: 352.
