Chijuan Hu
Master of Applied Science, 2008, Department of Chemical Engineering and Applied Chemistry
University of Toronto
Abstract
An electrochemical double-layer capacitor (EDLC) is a potential buffer for current power and energy supply. In this work, activated carbon derived from fluid coke as a brand new material was studied for its potential as an electrode material due to its high specific surface area (SSA) and large portion of mesopores. A suitable electrode material formula (AC:TR:PTFE=90:6:4wt%),current collector, counter electrode, and cell configuration were investigated to fabricate a testable system and ensure the reproducibility of measurements. Cyclic voltammetry (CV) and constant current charge/discharge (CD) techniques were used to characterize the performance of the electrode material, as well as to study its fundamental behaviour. A new procedure was established for quantifying the capacitance (Cc) of EDLC from CV which isolates the effect of internal resistance on the measured capacitance (CM) and creates a capacitance profile to better understand the performance of the capacitor cell during the charge/discharge process. The specific capacitance of single electrode made of activated carbon (~1900 m2/g) with approximately 80% mesopores and macropores was able to reach 180 F/g at scan rate of 0.5mV/s, which is comparable to the best published values. Morphology and chemistry of the porous carbon are discussed.
1. Introduction
1.1 Motivation
Due to the increased energy consumption and the growing demand for low- or even zero-carbon emission energy sources, there is an increasing need for efficient, clean, and renewable energy sources. While energy based on electricity can be generated from renewable sources, such as solar or wind, the effective use of electricity generated from these intermittent sources requires efficient electrical energy storage (EES). For large-scale solar- or wind-based electrical generation to be practical, the development of new EES systems will be critical to effective leveling of the cyclic nature of these energy sources. EES devices with substantially higher energy and power densities and faster recharge times are needed if all-electric/plug-in hybrid vehicles are to replace gasoline-powered vehicles.
Batteries and electrochemical capacitors (ECs) are among the leading EES technologies today. Both are based on electrochemistry; batteries store energy in chemical compounds capable of generating charge, while ECs store energy directly as charge. ECs have higher energy density than conventional dielectric capacitors and higher power density than batteries. Other advantages of ECs include fast charging rate and long charging cycle life (up to 500,000 cycles) (Zuleta, 2005). Depending on the electric energy storage mechanisms, ECs can be classified into two types – electrochemical double layer capacitors (EDLCs) and pseudocapacitors, although there are EC devices that provide both double layer capacitance and pseudocapacitance at the same time. When an electrode made of conductive material is in contact with an electrolyte and has a voltage supplied to it, an opposite charge will form across the electrode-electrolyte interface, similar to the charge separation in conventional capacitors. In pseudocapacitors, however, Faradiac charge transfer occurs between electrolyte and electrode. Capacitance in pseudocapacitors arises due to redox reactions between several oxidation states of chemical elements.
In past 20 years or so, much research effort has been focused on improving energy and power densities and increasing the cycle life of ECs. An extensive and detailed account of scientific and technological research can be found in “Electrochemical Supercapacitors: Scientific Fundamentals and Technological Applications” (Conway, 1999). At present, the use of ECs ranges from large scale application such as seaport cranes, to very small home-use devices such as capacitor powered screwdrivers that can be fully charged within 1.5 min (Miller et al., 2008). The most promising market prospective of this application is the use of ECs for electric hybrid vehicles. It is especially favorable in stop-and-go traffic such as city transit buses because of the benefit of less fuel consumption and pollutants emission.
Due to its high specific surface area (SSA, up to 3000 m2/g), chemical resistance, and electric conductivity, activated carbon (or porous carbon) is widely used as electrode material in EDLCs. In activated carbon-based electrochemical capacitors, electrical energy is physically stored at the activated carbon surface, according to the theory of electrochemical double layer (Conway, 1999). In fact, the first EDLC device developed by General Electric Co in 1950s was based on porous activated carbon with aqueous electrolyte. Today’s commercial EDLCs are mainly activated carbon-based.
Oil sand fluid coke, a by-product from upgrading of bitumen, is stockpiled in large amounts and is essentially an industrial waste. It has been demonstrated that the fluid coke can be activated with KOH (Cai, 2008; Evans et al., 1999; Otowa et al., 1997) and/or SO2 (Chen, 2002; Demou, 2003). Activated carbon with high specific surface area (SSA, up to 2500 m2/g) has been produced with KOH. Unlike most of the commercial activated carbons, the activated carbon from fluid coke has a layered, open structure and contains many hetero-elements such as sulphur. These activated carbons have been studied by Chen (2002) and Cai (2008) in our group for their potential as adsorbents for various pollutants in gaseous and aqueous media, particularly heavy metals such as mercury.
This work investigates the properties of the fluid coke-derived activated carbon and its performance as the electrode material in an EDLC. It is hoped that the fluid coke-derived activated carbon can be eventually used to produce an EES product that is technologically sound and economically viable.
1.2 Objectives
The overall objective of this study is to establish the technical feasibility of using fluid coke-derived activated carbon as an electrode material in an EDLC. Developing the methods and techniques required for producing and testing the activated carbon electrochemical double layer capacitor are a fundamental part of this work.
2 Literature Review
2.1 Electrochemical Double Layer Capacitor
2.1.1 Electrochemical Capacitor and Batteries
The electrochemical capacitor, also known as a supercapacitor or an ultracapacitor, is an intermediate power/energy storage/supply device that can provide higher energy density than a conventional electrostatic capacitor, higher power density than batteries (shown in Figure 2-1), as well as a much longer cycle life of up to 106 times (Emmenegger, 2003; Miller et al., 2008). P
ractically, electrochemical capacitors (ECs) have many applications, such as in telecommunication devices, electric/hybrid vehicles, and as stand-by and peak power sources. (Conway, 1999; Burke, 2000)
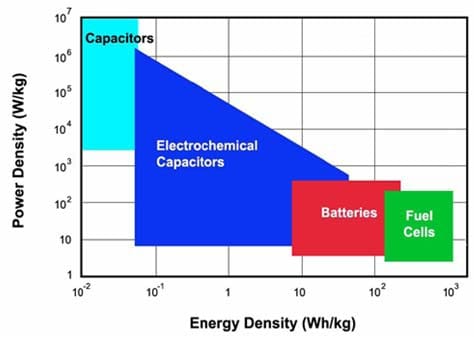
Figure 2- 1 Specific energy and power capabilities of capacitors (electrostatic), electrochemical capacitors (supercapacitors), batteries and fuel cells (Kötz et al., 2000).
There are three major categories of ultracapacitors: electrochemical double layer capacitors (EDLCs), pseudocapacitors and asymmetric capacitors. EDCL stores electric energy by using the capacitance formed at the electrode material and electrolyte interface. Hence, carbon materials with large surface area, such as carbon nanotubes (Emmenegger et al., 2003; Pico et al., 2007), carbon aerogels (Li et al., 2008; Fang et al.,2005; Zhang et al., 2006), carbon fibers (Kim, 2005) and skeleton carbons, are often used for fabricating EDLCs , The specific capacitance of EDLC is in the range of 100-240F/g (Li et al., 2006) and is much higher than conventional capacitors that are often in microfarads. A pseudocapacitor, on the other hand, stores energy by the capacitance arising from the Faradic reaction of compounds such as metal oxides (Conway, 1999; Zuleta, 2005). Ruthenium oxide (RuO2) is the most widely investigated material which can provide a specific pseudocapacitance up to 700F/g (Zhang et al., 2001), much higher than EDLC. However, its applications are limited by the very high cost of the material itself. The cost of EDLCs can be much lower than that of pseudocapacitors, if low-cost, effective carbon materials are available. Another advantage of EDLC is its long cycle life due to the reversible charge-discharge process that is not associated with any phase change or chemical reaction. Conducting polymer such as polythiophene (Rudge et al., 1994), polyaniline (Chen et al., 2003), and poly[3-(3,4-difluorophenyl)thiophene] (Li et al.,2002) can be used to induce pseudocapacitance and improve stability as well.
The last category, an asymmetric capacitor, combines a Faradaic electrode made with Pb/PbO2 or Ni(OH)2/NiOOH and a non-faradaic electrode such as carbon based double-layer electrode. The advantages of this asymmetric capacitor are higher specific capacitance, higher operating voltage i.e. higher energy density, and longer cycle life (Pell et al., 2004; Naoi et al., 2008; Wang et al, 2005).
In Table 2-1, several important parameters of batteries and capacitors are compared. People are more familiar with batteries, from button cells to Li ion laptop batteries , than EDLCs due to two main reasons: 1) batteries have a short cycle life and frequently need replacing (capacitors seldom need replacing); 2) EDLCs are not in common use though conventional capacitors (milifarads) are found in virtually all electronic circuits. With the development of supercapacitor technology and capacitance values up to several kilofarads a much broader range of applications will develop.
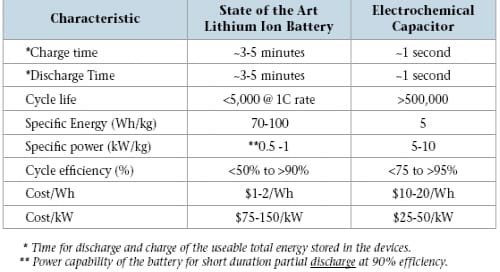
Table 2- 1 Comparison of some important characteristics of state of the art electrochemical capacitors and lithium-ion batteries (Miller et al., 2008)
Supercapacitors are most suitable for time dependent power demand used in short term pulses, i.e. short charge/discharge time. By lowering the cost and increasing the energy density, supercapacitors would be better positioned to compete with batteries in many application areas. This study explored the behaviour of a low-cost carbon material as the electrode in an EDLC. The following section elucidates the theory of EDLC.
2.1.2 Double Layer Theory
Capacitance is a measure of the ability of electrode materials to store electric charge. In a capacitor, capacitance depends on the size of the plates, distance between two electrodes, electrolyte and so on. Capacitance is measured in farads. When a steady voltage is applied across a capacitor, a charge +Q is stored on one plate while -Q is stored on the opposite plate. One farad (F) equals one coulomb per volt which is shown in the following equation:
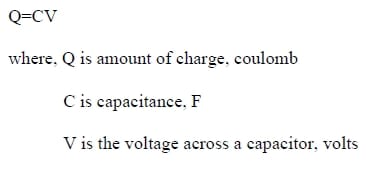
Figure 2.2 is schematics of a conventional capacitor and an electrochemical double layer capacitor in their charged state. According to Equation 1, the capacitance (C) of a conventional capacitor is proportional to the area (A) of the electrode and the dielectric constant of electrolyte which is given by the product of the permittivity constant for the dielectric (e) and the permittivity at vacuum condition (Ε0). It is inversely proportional to the charge separation distance (d). Hence, higher surface area, more conductive electrolyte and smaller distance between two electrodes result in higher capacitance (Emmenegger et al., 2003). Figure 2-2 (b) shows the structure of an electrochemical double layer capacitor in which there are two electrodes and a separator, along with a simplified charge storage mechanism. Positive ions accumulate next to negatively charged surface while anions are attracted to the positively charged surface. The ion conductive separator is used to prevent electronic conduction between the electrodes. The capacitance of a single electrode in EDLCs can be treated as a conventional capacitor (Frackowiak, 2007). Equation 2 shows the relationship between total capacitance (Ct) and single electrode capacitances C1, C2. As such, the total capacitance is determined by the electrode with smaller capacitance (Pell et al., 2004; Frackowiak, 2007).
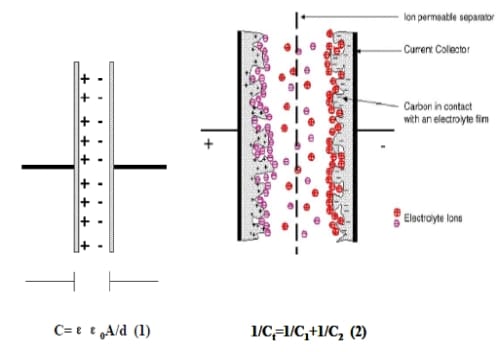
Figure 2- 2 Schematic of (a) conventional capacitor (b) electrochemical double layer capacitor in its charged state (Zuleta, 2005; Pandolfo et al., 2006).
Seen from Figure 2-3 in below, in the modern model, the double layer consists of the Helmholtz layer (between the inner and outer Helmholtz planes) and the diffuse layer. Due to the small scale around nm, the thickness of these layers is difficult to measure directly. Theoretical models are therefore needed to elucidate the charge storage mechanisms. Three main models were initially used:
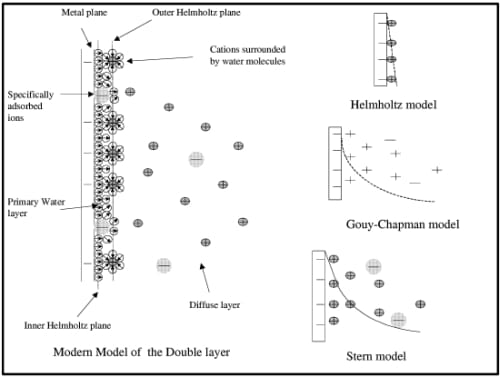
Figure 2- 3 Illustration of modern model at the left and three earlier models at the right, Helmholtz (top), Gouy-Chapman model (middle) and Stern model (bottom) (Zuleta, 2005).
(1) Helmholtz model – This model assumes the potential profile within the double layer is linear, which is similar to the charge storage depicted in Figure 2-2 (a), where positively charged electrode material is on one side and negative ions are on the other side of the double layer. However, this model does not consider the adsorption of water molecules and counter ions.
(2) Gouy-Chapman model – This model assumes the charges decay rapidly and continuously from conductive material to electrolyte without distinct layer separation. This model successfully predicts the temperature and potential effects on the capacitance and is accurate for low electrolyte concentrations, i.e. low surface charge density. However, the distorted structure by steric effect and hydration force or overlapping problem occurring in the nanopores are not taken into account for this model.
(3) Stern model – The Stern model is a combination of Helmholtz model and Gouy-Chapman model. The capacitance from this model is the sum of capacitances of the Helmholtz fixed layer (CHP) and Gouy-Chapman diffuse layer (CGC).When the concentration of electrolyte is high, the diffuse layer effect can be
ignored.

Similar to the Helmholtz model, this model does not take into account the adsorption of water molecules and other adsorbed ions. In more recent models, these two effects are considered and accounted for in the calculation of capacitance. However, the modern models still cannot be used to elucidate the situation inside the nanopores and to predict the complications associated with nanopores such as ion pairing and limited mobility. More accurate models are needed to better understand the double layer structure. Despite the theoretical difference between EDLC and pseudocapacitance, often both contribute to the actual capacitance of a supercapacitor. Calculation of the capacitance of the supercapacitor is more difficult due to the complex phenomena occurring near the pores and the pseudocapacitance involved (Burke, 2000).
2.1.3 Important Equations
Several equations are commonly used to calculate important parameters of capacitors. The following equation defines capacitance:
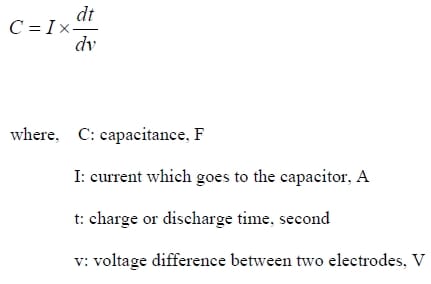
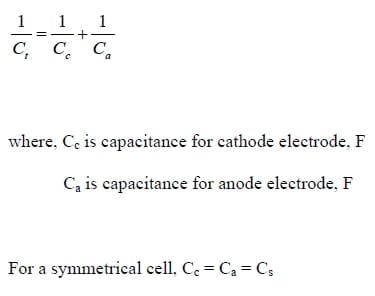
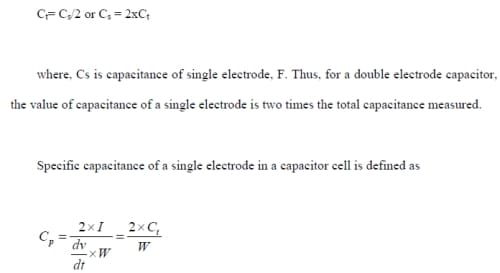
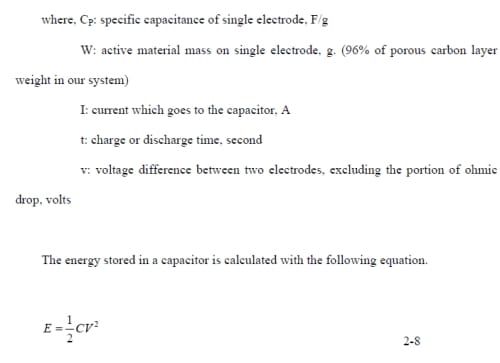
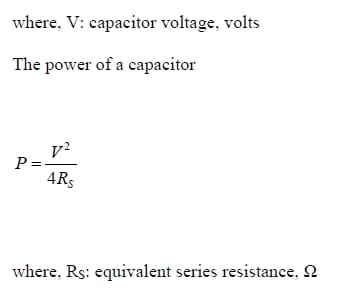
Thus, from the equations (2-8) and (2-9), it is notable that by increasing the capacitor voltage V, both of the energy and power can be greatly increased. Capacitor voltage is often limited by the thermodynamic stability range of electrolyte which is 1.23V for aqueous electrolytes, while organic electrolytes can reach 2.5 V but with the drawback of lower conductivity. Ionic liquid and asymmetric capacitors can be good options to increase capacitor voltage (Pell et al., 2004; Frackowiak, 2007).
2.2 Characteristics of Activated carbon as Electrode Material
2.2.1 Advantages of Activated Carbon Material
Activated carbon has attracted much attention as an electrode material for EDLC due to its promising features:
- excellent corrosion resistance (Beck et al., 2001),
- high specific surface area (SSA) ~3200m2/g (Kierzek et al., 2004)
- high temperature stability (Pandolfo et al., 2006),
- high electronic conductivity (Pandolfo et al., 2006),
- acceptable cost (Pandolfo et al., 2006; Frackowiak, 2007),
- various pore structure and pore size distribution (Gryglewicz et al.,2005)
2.2.2 Sources of Activated Carbon and Modification
Activated carbon can be produced from a wide variety of carbon-rich raw materials, including wood, coal (Lee and Choi, 2000; Mitani et al., 2004), peat, coconut shells (Hu et al., 1999), nut shells, lignin (Hayashi et al., 2000), bones and fruit stones. New materials such as oil sand fluid coke (DiPanfilo and Egiebor, 1996; Chen, 2002; Demou, 2003) are currently being studied for their potential as raw materials of activated carbon.
Activated carbon is especially desirable due to its large surface area, and porosity suitable for the size of electrolyte ions which is critical for charge storage (Frackowiak, 2007). In literature, some coal or pitch-derived carbonaceous materials were activated by KOH at elevated temperature to create porous structures with very high surface area up to 3000m2/g(Raymundo-Pinero et al.,2006). A similar activation technique is used to produce fluid coke derived activated carbon. Effects of activation conditions such as KOH to C mass ratio and temperature on capacitance has been studied (Li et al., 2006; Kierzek et al., 2004). In general, higher KOH to C mass ratio (4:1) and moderate temperature (~700oC) can produce higher SSA which consequently provide higher capacitance.
Some heteroatoms such as oxygen or nitrogen can act as surface functional groups on AC to affect the charging of the electrical double layer by pseudo-faradic reaction. Some common acidic or basic functional group may include quinoid, quinhydrone, phenolic, carboxyl, carbonyl and lactone. Under certain conditions like adding sulfur into activated carbon, sulfate compounds may also be found (Qu, 2002). Meanwhile, these hydrophilic function groups can enhance the wettability of the carbon surface and therefore maximize the access of electrolyte ions into pores (Pandolfo, 2006). For instance, the coal activated at 700oC has higher Cp (F/g) and gravimetric capacitance (F/cm2) values than at 800oC despite a lower BET surface area, likely due to its higher oxygen content. The higher oxygen content was thought to improve the wettability or induce the reversible redox reactions which can contribute to an additional pseudocapacitance (Raymundo-Pinero, 2006; Centeno et al., 2006).
Modified activated carbon materials such as polyacrylonitrile (PAN)-based activated carbon fibers (Wang et al., 2006) and templated mesoporous carbons show superior performance in terms of capacitance but is much more expensive (Liu et al., 2005; Fuertes et al., 2005; Xing et al., 2006).
2.2.3 Effect of Pore Size Distribution and Specific Surface Area
The energy storage mechanism for electrochemical double layer capacitor mainly depends on the electrostatic attraction between charges which was built up at the interface of electrolyte and electrode surface. So the properties of the activated carbon are the key factors which directly influence the capacitance.
Different kinds of activated carbon have different SSA and PSD, because they are made from different precursors by different physical or chemical activation processes (Gryglewicz et al., 2005).
In general, high SSA was desired for EDLC. According to Li et al. (2006), the specific capacitance Cp can increase from 100 to 270F/g when SSA is within the range of 366-2478 m2/g. Without doubt, the higher surface area provides more interface for the formation of double layers which leads to storage of more energy.
Janes et al. (2007) investigated electrochemical properties of a commercial nanoporous carbon (RP-20) which was activated at three different temperatures 950, 1050 and 1150oC. The sample activated at 1050oC had the largest surface area and provided the highest specific capacitance in organic electrolyte. Similar results were found for the bituminous coal activated at different temperatures, 520 to 1000oC (Raymundo-Pinero et al. 2006). The largest specific capacitance Cp of 250F/g was found with the largest specific surface area of 2740 m2/g, while the lowest Cp reached 125F/g with the lowest SSA of 800 m2/g.
PSD is another key factor that influences the capacitance. In reality, not all the BET surface area is electrochemically accessible. Large pores such as mesopore (2-50nm) or macropores (>50nm) are more suitable for ion diffusion and hence high power application. However, large pores will in turn decrease the specific surface area. Micropores (<2nm), especially ultra-micropores below 1nm, have been reported to have significant beneficial impact on charge adsorption and accumulation (Frackowiak, 2007). A suitable amount of mesopores ensures a rapid mass transport of electrolyte ions to the bulk of electrode material during the charge/discharge process (Qu and Shi, 1998; Wang et al., 2006).
A template method has been used to prepare mesopores with controll
ed pore size distribution and has demonstrated superior electrochemical performance (Tamai et al., 2003, Fuertes et al., 2005). For example, Xing et al (2006) found that capacitors using ordered mesoporous carbons exhibiting a high capacitance of over180 F/g even at very high sweep rate.
Using various electrolytes, it was demonstrated that an adequate pore size is more important than a high surface area. The optimal pore size was reported to be near 0.7 nm for aqueous and 0.8 nm for organic electrolytes. At the optimal pore size or beyond that, the number of ions participating in the double layer formation per volume unit is nearly constant (Raymundo-Pinero, 2006). It is clear from these results that capacitance is not directly proportional to specific surface area and other factors must be important.
Another capacitance, specific surface capacitance (F/cm2) is also widely used. Sometimes, conflicting trends are observed when the capacitance is calculated on the basis of BET surface area while Cp is based on mass. For instance in one study, coal-tar pitch was used as precursor and activated at several different temperatures 500, 600, 700, 800, 900, 1000 oC with KOH as the activating agent. The sample activated at 500oC had the smallest Cp and lowest SSA, but had the largest specific surface capacitance. The explanation provided for this behaviour is that the inner pore of activated carbon consists of two kinds of structure, basal plane and edge plane. The basal plane structure has the lower capacitance caused by low conductivity of basal edge. The low temperature causes the smaller proportion of basal planes and increases the specific surface capacitance. Meanwhile, the higher mass ratio of KOH to C (~4:1) which increase the SSA may cause complex pore shape formation and deepen the pores. Thus, the interconnection between the pores becomes difficult for electrolyte to penetrate and, as a result the capacitance decreases (Li et al., 2006).
2.3 Characterization of Capacitor Behaviour
2.3.1 Techniques of Electrochemical Characterization
The electrochemical performance of EDLCs is commonly investigated by three techniques: cyclic voltammetry (CV), constant current charge/discharge (CD) and electrochemical impedance spectroscopy (EIS). Each of the techniques will be discussed in detail.
Cyclic voltammetry is the most widely used and often the first measurement performed for understanding an electrochemical system. Cyclic voltammetry is carried out within a fixed potential range to avoid gas revolution and at a fixed scan rate, i.e. a linear variation of potential with time. The resulting Potential (E)-Current (I) plot is named a cyclic voltammogram where current is a response on Y-axis (Figure 2-4).
As shown in Figure 2-4 (a), a rectangular cyclic voltammogram suggests a pure capacitive behavior of an ideal double layer capacitor without any chemical reaction. Figure 2-4 (b) is a cyclic voltammogram of a system with reversible redox reaction, showing peaks at certain potentials. One important application of cyclic voltammetry is for providing information of thermodynamics of redox reactions and the kinetics of heterogeneous electron transfer.
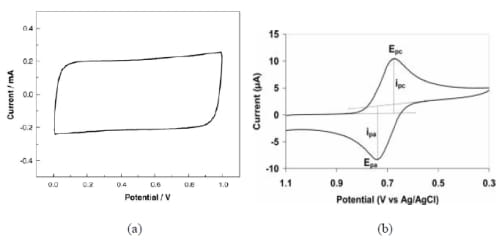
Figure 2- 4 Cyclic voltammogram of (a) an ideal double layer capacitor (b) pseudocapacitor (Xu et al., 2006).
Constant current or galvanostatic charge/discharge is in principle the same technique as cyclic voltammetry but with fixed current and charge/discharge time. Thus, the potential is obtained as a response on Y-axis.
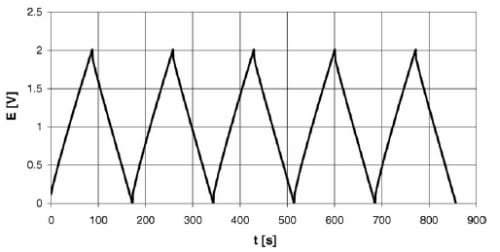
Figure 2- 5 Five cycles of constant current charge/discharge (Fuertes et al., 2005).
A representative graph of charge/discharge is shown in Figure 2-5. Time (t) versus potential (E) plot of a charge/discharge process shows a slightly curved triangular shape. At the beginning of discharge process, there appears a sharp drop in potential, i.e. ohmic drop (Yang et al., 2005). This rapid potential drop is an advantage of this method in that the relationship V= IR allows the quantification of system resistance. This method is commonly used in industry to test commercial capacitor cells.
Weng and Teng (2001) compared capacitances obtained from cyclic voltammetry (CV) and constant current charge/discharge (CD) tests. They found different capacitance values and commented that the differences may be due to the different currents employed for these two methods. This, however, has been disproved from other experimental results. Most of the literature only gives the superficial capacitance value, and none of them compare the value from different methods and explain whether it is consistent or not. In this work, the method of calculating capacitance has been further investigated which assists in better understanding the electrochemical process.
Electrochemical impedance spectroscopy (EIS) supplies additional information about the capacitor performance such as frequency (f) dependence and equivalent series resistance (ERS) (Fuertes et al., 2004). EIS test results in a so-called Nyquist plot with real (Z’) which corresponds to the equivalent of ohmic resistance and imaginary components (Z”) which reflects the non-resistive elements (Li et al., 2006). As shown in Figure 2-6, a typical EIS curve, i.e. Nyquist plot, consists of a single semi-circle in the high-frequency region and a sloped line in the low-frequency region (Chen and Wen, 2003). The magnitude of the resistance can be estimated from the radius of the semi-circle, whereas the diffusion is characterized by the linear area at lower frequencies. The impedance spectra are always measured over a wide frequency range of 1mHz-1MHz which depends on the ability of machine.
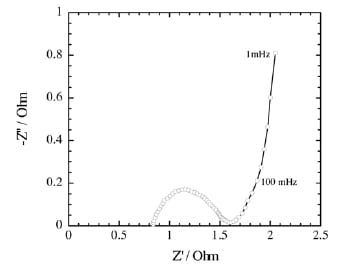
Figure 2- 6 Nyquist plot for electrochemical double layer capacitor using carbon aerogel (Wei et al., 2005)
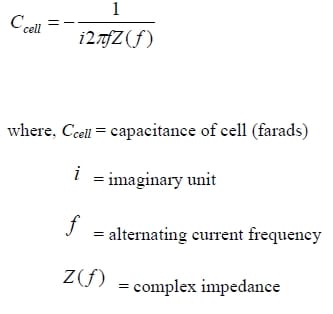
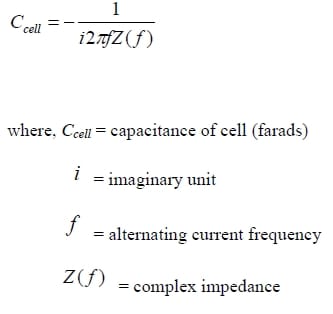
Table 2- 2 Summary of techniques used for electrochemical test and comparison of specific capacitance based on different electrode materials and electrolytes.
2.3.2 Single Electrode vs. Unit Cell
Two kinds of experimental setups are used to test the performance of electrochemical materials: single electrode and unit capacitor cell. A unit capacitor cell is structurally similar to a capacitor product while a single electrode can provide detailed information about electrode material excluding effects of cell structure.
Normally, a single electrode is tested in a so-called “three-electrode cell” in which the carbon electrode material acts as the “working” electrode and the potential of the electrode is measured relative to a reference electrode. The cell is completed by a counter electrode. Current or voltage is applied between the working electrode and the counter electrode. Some researchers use single electrodes to investigate the electrode material (Qu, 2002; Chen and Wen, 2003; Xing et al., 2005;), while others fabricate unit capacitor cells with two single electrodes to simulate a real capacitor and obtain more information of practical performance (Li et al., 2006; Sivaraman et al., 2003; Gu et al., 1999; Xu et al., 2005). Yet, Wada et al. (2004), Yang et al. (2005), Wang and Teng (2006) used both setups to investigate the relationship between a single electrode and a unit cell.
In order to better understand the system, single electrode and capacitor cell methods are both applied in this work.
2.3.3 Effects of Electrolyte
There are mainly two
kinds of electrolytes used in EDLCs: aqueous and organic electrolyte. Generally, an aqueous electrolyte has better conductivity than an organic one, but has the shortcoming of smaller operating voltage range. Normally, the thermodynamic stability of water is 1.23V, so the operating voltage usually cannot go beyond 1.2V to avoid decomposition of water, and the nominal cell voltage of aqueous electrolyte cells is around 0.8V (Miller and Simon, 2008). The small cell voltage limits energy/power density of single cells and their applications. At present, H2SO4 (Bleda-Martinez et al., 2005; Chen et al., 2003; Niu et al., 2006) and KOH (Park et al., 2002; Wada et al., 2004) are the two most common aqueous electrolytes used.
Common organic electrolytes are tetraethylammonium tetrafluoroborate (TEABF4) in acetonitrile (Hahn et al., 2006; Hardwick et al., 2006) or in ester-based solvent propylene carbonate (Morimoto et al., 1996; Hahn et al., 2005) and are the preferred choices of commercial supercapacitor manufacturers. Ammonium-based ionic liquid can increase the cell voltage to 2.3-2.5V and lead to a greater increase in energy density which is proportional to the square of cell voltage. Meanwhile, organic electrolytes allow a wider choice of current collector material such as Al (Zhang et al., 2001) which can not be used in KOH. However, the drawback of organic electrolyte is the low conductivity and often poor wettability of the carbon by the solvent which decreases the specific capacitance. The size of ions in organic electrolyte is much larger than in aqueous electrolyte (Burke, 2000). Most currently used liquid organic electrolytes are flammable and leakage is a problem. New electrolytes are being developed to avoid this issue. For example, solid polymer electrolytes such as alkaline polyvinyl alcohol (PVA) (Yang et al., 2005), lithium salts (LiBF4) in polyvinylalcohol (PVA) (Park et al., 1997), polyaniline and sulfonated poly (ether ether ketone)(SPEEK)(Sivaraman et al., 2003), and gel electrolyte such as poly (vinylidene fluoridehexafluoropropylene) (PVdF-HFP) (Osaka et al., 1999) have been reported.
In recent years, to increase the voltage range, ionic liquid (ILs) electrolytes consisting of thermally stable organic salts have been developed. These orgnic salts are in liquid state at room temperature but often have high viscosity which is undesirable in terms of wettability of electrode surface. The conductivity of ILs is not as good as aqueous electrolyte and as a result hinders the performance of capacitor.
Due to the lower conductivity of organic electrolyte and the dangerous of its flammability, aqueous electrolyte is desired in our experiment. Meanwhile, KOH has relatively smaller ion size than H2SO4 which would easier penetrate into pores and provide better performance, so 6M KOH is applied.
2.3.4 Effect of Resistance
In all electrical circuits there is resistance to electron flow. For an EDLC there will be resistance from the testing equipment as well as contact resistances, electrode resistances and ionic resistances arising from the device or electrode. Some of these resistances reflect properties of the activated carbon such as carbon-carbon contact, electrode carbon contact, electrolyte carbon contact and electrolyte conductivity within the carbon pores. Therefore, understanding the sources of resistance is essential to optimizing the capacitor performance. The total internal resistance within capacitor is normally termed as equivalent series resistance (ESR) which contains all the resistances associated with ion and electron transport (Lanzi et al., 1990; Srinivasan et al., 1999). In principle, it is due to the electrical resistance of electrode material (Pandolfo et al., 2006), the ionic resistance from ion diffusion resistance of bulk electrolyte solution which is dependent on the electrolyte type and concentration, from resistance of the separator, from resistance of binder within the electrode (Lufrano et al., 2004) and from numerous contact resistances.
It has been reported that 90% of the internal resistance comes from various interfacial electrical resistances (Zheng, 2004; Ganesh et al., 2006), such as contact resistance within porous carbon layer and those between the electrode material and current collector (Hahn et al., 2001). It can be influenced by carbon morphology, particle size, cleanliness of the metallic substrate and containment pressure in the cell.
Potassium hydroxide is a well known wetting agent which has good conductivity at high concentrations. Thus, in this work, 6M KOH was considered to be ideal for minimizing bulk solution resistance allowing good surface wetting.
3. Objectives and Tasks
Fluid coke derived activated carbon is a new and promising material for EDLC application which is investigated in this work. The overall objective is to better understand the activated carbon and its potential as an electrode material in EDLC. In order to evaluate the performance of this activated carbon, it is essential to fabricate a testable electrode and build a capacitor cell which can provide reliable experimental results. A suitable current collector, counter electrode, cell configuration were required to be determined to ensure the reproducibility of measurements. Various techniques were required to characterize the activated carbon properties such as the SSA and PSD, conductivity, and morphology. Both cyclic voltammetry (CV) and constant current charge/discharge (CD) methods were chosen to evaluate the electrode and the capacitor cell for their capacitance, stability and internal resistance. The method to properly calculate capacitance was also investigated due to the inconsistency found in reporting capacitance data in the literature. A scientific goal was to better understand the effect of pseudocapacitance and establish a more accurate and reasonable method to calculate capacitance.
To achieve the objectives, following tasks were carried out.
- Develop a procedure for fabricating an adherent and stable porous carbon layer as the electrode material.
- Determine the resistance of each component within the system such as resistance of electrode material, of electrolyte and of contact.
- Develop a procedure for constructing an EDLC cell in which the internal resistance can be consistently controlled
- Determine a suitable current collector and counter electrode for evaluating the performance of the electrode.
- Establish a procedure for evaluating the performance of the activated carbon EDLC by measuring capacitance, internal resistance and stability.
4. Experimental
4.1 Material Preparation and Characterization
4.1.1 Raw Materials
The materials used to fabricate the electrode are composed of fluid coke derived activated carbon (AC), tire residue (TR) which is used to increase the conductivity and help bind AC particles, and polytetrafluoroethylene (PTFE) (Aldrich, 60 wt% dispersion in water) which is used as binder. These materials are mixed to make a dough which is rolled to porous carbon layer.
The fluid coke derived activated carbon (K-PN-900C-2.5h-R2.0) was prepared from fluid coke by other members of this group (Cai, 2008).As indicated by the sample name, to activate the coke, it was treated with KOH at KOH:C ratio of 2:1 and 900oC for two and half hours without any pretreatment. The properties of the activated carbon are summarized in Table 3-1 below, along with those of the tire residue.
The activated carbon and the tire residue are the main active electrode materials used. The Coulter SA3100TM Surface Area and Pore Size Analyzer was used to determine their porous structure. The analyzer uses nitrogen as an adsorbate, which is adsorbed physically at 77K on the surface of activated carbon. The volume of the gas adsorbed (Y-axis) and the relative value of measured sample pressure divided by the saturation vapor pressure (X-axis) are recorded to con
struct the adsorption isotherm. BET (Brunauer, Emmett and Teller) method was applied to calculate SSA and BJH (Barrett, Joyner, and Halenda) method was used to calculate pore volume and PSD. The t-plot(thickness-plot) is produced by plotting volume of gas adsorbed vs. the adsorbate molecular film thickness. The slope of the linear section can be used to calculate the meso/macro pore surface area by the equation of SSA meso/macro=1547×t-plot slope (1547 is a coefficient of a conversion at standard pressure form gas to liquid (Coulter SA3100 Analyzer, product manual, 1996).
The detailed procedure is given as follows:
- Dry the glass tube holder and samples overnight at T= 100oC and cool them down before use. If weighing the carbon film, cut the film into small pieces (~ 1.7cm2) to prevent them from sticking in the tube.
- Turn on the nitrogen gas and initialize the measurement.
- Weigh the sample and glass tube holder separately and record the data. Put the sample in holder and weigh them together. Record the original total weight. Install the holder in the outgas part of the machine and start outgas at elevated temperature of 120oC under vacuum in order to remove the moisture and air from the pores.
- Weigh the total weight again after outgassing. The true sample weight would be the new total weight minus the weight of glass tube which excludes the moisture and air. We will use this true value to calculate SSA later on.
- The holder with sample is moved to analysis port and liquid nitrogen is poured into the small tank in which the holder will be immersed during the analysis process. Then the BET ((Brunauer, Emmett and Teller) analysis can be started to generate BET adsorption isotherm.
- The machine will automatically calculate the SSA based on BET equation and adsorption equation and get PSD by using the BJH (Barrett, Joyner, and Halenda) method.
- Record the output results and repeat the steps for the new samples.
As shown in Table 4-1, the fluid coke derived activated carbon is quite porous with a very large SSA. The large t-plot surface area suggests that a large portion of the surface area (~ 80%) can be attributed to meso- and macropores. SSA of the tire residual is rather small and is likely contributed by the external surface of particle of tire residue (under 200mesh) which has no micropores.
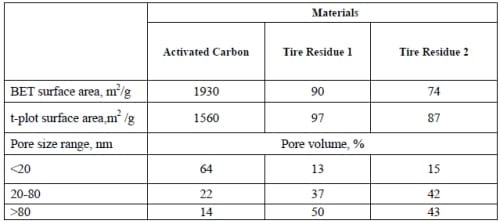
Table 4- 1 Specific surface area (SSA) and pore size distribution (PSD) of activated carbon (K-PN-900C-2.5h-R2.0) and tire residue.
Table 4-2 gives the chemical composition of the activated carbon (by CE-440 Elemental analyzer). As expected, it is enriched with carbon (~ 90%) and has lower hydrogen and nitrogen content. Oxygen content is high and likely due to the activation process where KOH was used as the activating agent, although the actual form of the oxygen is uncertain. Since the activation process produces carbon dioxide and carbonate, the existence of carbon oxide groups is anticipated.

Table 4- 2 Elemental composition of activated carbon (wt%)
4.1.2 Temperature Pretreatment of Activated Carbon
In order to better understand the double layer capacitive behavior, the activated carbon is pre-treated (before being made into an electrode) at high temperatures using a vertical split tube furnace under inert gas to remove the oxygen or other volatile matters. High temperature treatment also may enhance graphitization and increase conductivity of carbon material (Pandolfo et al., 2006). The detailed procedure is listed as follows:
- Dry samples at T=100oC overnight to remove moisture.
- About 5g of activated carbon is placed in the quartz tube and centered in the vertical split furnace.
- Connect all the tubes. Seal all the connection with high vacuum grease and use clamps as well to ensure no gas leaks out.
- Open the nitrogen gas and turn on the gas flow meter. Wait a few seconds for the N2 gas reach the pressure and go through all the tubes.
- After the flowmeter is stable, adjust the flow to 140ml/min for the experiment. Make sure there are bubbles coming out from the end of the tube immersed in water. If not, check all the connections.
- Turn on the furnace and set the desired temperature. Normally the sample is heated for 4hours with the temperature not higher than 1100oC.
- When the experiment is done, turn off the furnace first and wait until the temperature goes down to room temperature, then finally turn off the N2.
4.1.3 Scanning Electron Microscope (SEM) Analysis of Carbon Sample
A Scanning Electron Microscope (Hitachi S5200TM) was used to provide images with detailed information about the morphology of carbon material or porous carbon layer. Before the test, some sample preparation is needed, because the cross section of the particle is of interest to us. Large particles are broken into smaller pieces by placing them between two thin glass slices and applying force to the top glass slice. Conductive carbon paint was spread on the surface of an aluminum holder for sticking the sample particles. Finally, the cracked particles were poured on to the holder and then the holder was placed into the analysis chamber.
4.1.4 Resistance Measurement of Carbon Material
The setup for measuring resistance of the carbon material consists of a glass tube (5.1mm ID, 7.1mm OD and 12 cm in length), a nickel stick rolled from foil that can be inserted into one end of the glass tube, and a nickel cap made from foil that fits the outside of the other end of the glass tube. The carbon sample is pressed between nickel stick and nickel cap which are connected with the two clamps to an AC Electrometer (Keithley-614) for resistance measurements. To minimize the contact resistance, a force up to 3 kg is applied between two ends of the carbon material in the glass tube. The procedure of resistance measurements is given below.
- Assemble the Ni stick, Ni cap and glass tube together and put the two clamps of the ohm-meter on the cap and stick respectively. Adjustment is often needed to ensure that the contact resistance between the clamps and the two Ni parts is zero.
- Mark the glass tube at different lengths from 1 to 10cm, and then use thumb to block one end of the tube and squeeze in carbon material little by little using a small tweezer. The material inside the tube was squeezed by nickel stick until it is compressed.
- Step “ii” is repeated until reaching the mark and then put the cap on.
- Put clamps on and place tube vertically on the balance. The nickel stick was pushed down until the specified weight is reached. The pressure was kept constant, resistance data were read and recorded on the AC Electrometer.
- Remove the carbon sample from the tube using the small tweezer before starting a new test. This procedure is used for measuring the resistance of the carbon material without electrolyte (KOH).
- To test the material resistance with KOH, after the material is filled in the tube, a certain amount of KOH solution are added into tube and squeezed by nickel stick together. If the material is not enough to reach the mark line, more carbon material and KOH solution are added and pressed together.
Reproducibility using the same sample with multiple measurements was 2.1% without KOH and 2.8% with KOH.
4.2 Fabrication of EDLC Electrode and Capacitor Cell
4.2.1 Preparation of the Porous Carbon Layer for Electrode
The electrode material used in the experiment consists of 90 wt% activated carbon, 6wt% tire residue and 4wt% PTFE (Aldrich, solution form of 60% PTFE in H2O). The procedure for making the
electrode material which is also called “porous carbon layer” is as follows:
- Activated carbon and tire residue were both dried at 100oC in oven overnight to remove the moisture. They were then cooled down in a desiccator for 1 hour.
- Normally the samples are made on a 1g basis. AC and TR were weighed and recorded separately according to the weight percentage. Then, they were mixed and ground together in agate mortar.
- PTFE was weighed and well dispersed in isopropyl alcohol by ultrasonic shaking (Aqua-Sonic Model 150D).
- Poured the physically mixed AC and TR into the well dispersed PTFE solution in a beaker.
- Place the beaker on the top of hot plate at the lowest setting and constantly stir it with a glass rod to evaporate the solvent and further mix the components.
- Once the isopropyl alcohol had almost completely evaporated, the dough was ready to be transferred to a pasta maker for rolling the carbon film.
- The dough went through seven different grades of gap (from 5cm to 0.5mm) which successively reduced its thickness to about 0.6 mm.
- The prepared film was put into an oven and baked at 100oC for 24 hours during which time the remaining isopropyl alcohol and/or moisture in the film evaporated.
- The large piece of film (~20 cm2) was cut with a cork borer into small pieces of wafers about 1.7 cm2 (diameter of 1.47cm).
4.2.2 Construction of Single Electrode
As shown in Figure 4-1, a single electrode is assembled with three parts; electrode material (carbon film), current collector (nickel mesh) and copper wire. The following is the procedure to assemble an electrode.
- The weight of each wafer made according to the procedure stated above was recorded for specific capacitance calculation.
- Nickel mesh (Alfa Aesar, 100 mesh) was cut into 2 cm × 2.5 cm rectangular shape.
- Two pieces of carbon wafers were squeezed onto each side of the nickel mesh using a Carver oil press. The nickel mesh and wafers were placed between two heavy steel blocks whose surface is polished. The pressure (2900 psi or 20 MPa) was applied and kept for 5 min.
- The copper wire then spot welded to the nickel mesh using a spot weld device (Forward Precision Equipment Ltd, FW2-P)
- Since copper is corroded in aqueous KOH solution, a non-conductive, corrosion resistant epoxy is applied to completely coat the wire. The coating was from a well mixed epoxy resin and CURE (Amercoat® 90HS) in a volume ratio of 4:1.
- 3 Coats of epoxy were applied on the exposed metal within 36 hours. The epoxy needs 12 hours to dry completely at room temperature.
- After the coating is done, the electrode can be connected and tested.
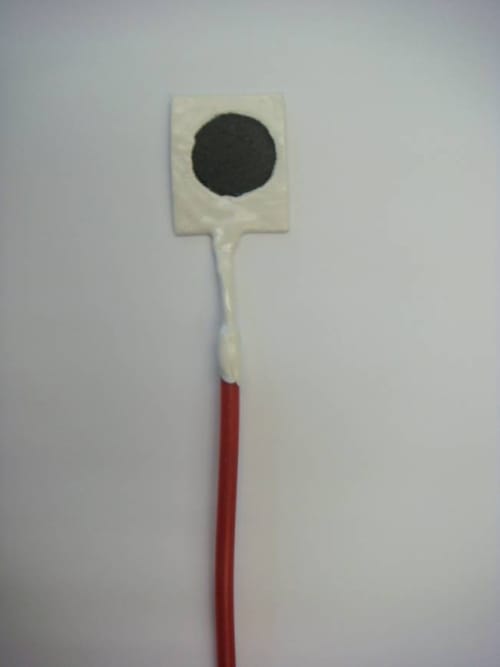
Figure 4- 1 Photo of a self-made single electrode
4.2.3 Fabrication of Capacitor Cell
Figure 4-2 shows some prepared capacitor cells. A capacitor cell was made of four components: i) active material-two wafers of the carbon film, ii) a porous and electronically non-conductive separator (Ryton) between the two wafers, iii) current collector made from nickel mesh at the back of each wafer, and iv) two pieces of Lucite (polymethylmethacrylate) (4cm×3cm×0.4cm) to affix the first three components.
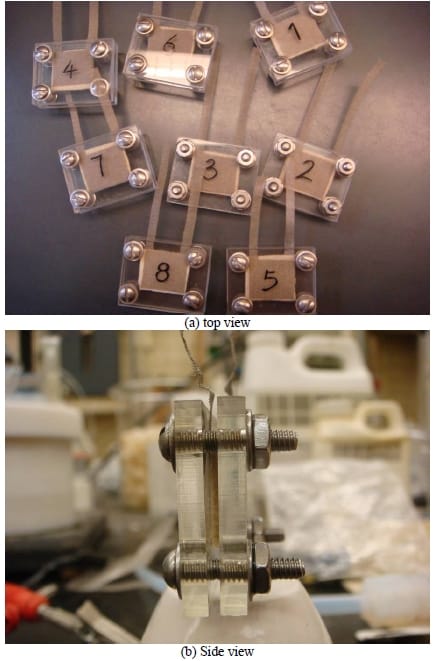
Figure 4- 2 Front and side view of prepared capacitor cells
The procedure for making the cell is described follows:
- The carbon wafers were weighed and recorded. Two pieces of carbon wafers with one piece of Ryton in-between were sandwiched in the cell.
- Two pieces of nickel mesh were cleaned by 0.1 M H2SO4 and washed with deionized water before use. Carbon wafers and separator were placed between them.
- Four holes were drilled in the corner of the two pieces of plastic frame and four screws were inserted into the holes.
- By placing all the other three parts between the frame and tightening the screws, the whole cell is constructed.
- In order to keep pressure constant for each cell, the gap between the two plastic plates was kept consistent (the tightest distance is around 2.5mm.), or by using pressure sensor paper (Fujifilm®, ultra super low pressure prescale film), as shown in Figure 4-3
- The density of red dots represented the relative pressure; more dots in the central part illustrated more pressure applied on the carbon wafers. By applying pressure until the dot density looks similar, the pressure for each cell were able to be kept relatively constant.
- The whole cell was immersed into the beaker filled with 6M KOH electrolyte and tested.
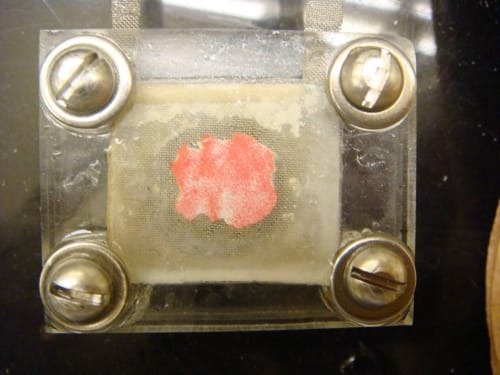
Figure 4- 3 A capacitor cell assembled with pressure sensor paper
4.3 Electrochemical Measurements
4.3.1 Solartron 1280B/1280C Electrochemical Analyzer
Solartron 1280B/1280C electrochemical analyzer (Figure 4-4) was used for the main part of the experiment to test the electrochemical properties of the electrode and the capacitor.
The features of this device include: i) maximum voltage up to 15 V and current to 2 A. ii) frequency range from 0.01 Hz to 20k Hz, iii) simultaneous measurement of voltage and current, iv) installed software-Corrware and Corrview.
There are four cables connecting analyzer and experimental devices which are labeled as: WE (working electrode), CE (counter electrode), RE1 (reference electrode 1), and RF2 (reference electrode 2). For three-electrode testing setup, WE and RF1 were connected as one connection, while CE and RF2 provided other two connections. However, for the two-electrode setup, combined WE+RF1 and combined CE+RF2 provided two connections
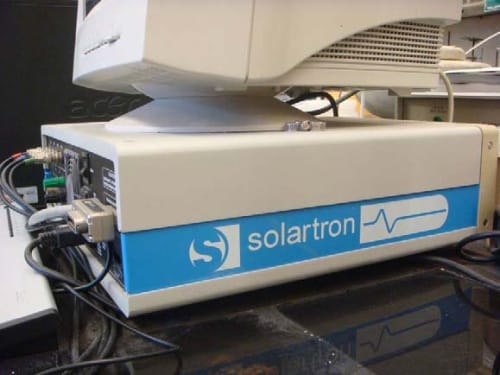
Figure 4- 4 Solartron 1280B/1280C electrochemical analyzer
Corrware is the software used to control the analyzer and can be applied to different DC applications by choosing different programs. For example, cyclic voltammetry (CV), galvanic cycling (cycles of constant current charge/discharge (CD) test), controlled potential/current step techniques and open circuit measurement can all be performed with the same device and software. Corrview is used to view the graph and data and to export the data to a common “word” or “text” files.
4.3.2 Three- Electrodes Cell for Capacitance Measurement
Corrware is the software used to control the analyzer and can be applied to different DC applications by choosing different programs. For example, cyclic voltammetry (CV), galvanic cycling (cycles of constant current charge/discharge (CD) test), controlled potential/current step techniques and open circuit measurement can all be performed with the same device and software. Corrview is used to view the graph and data and to export the data to a common “word” or “text” files.
Shown in Figure 4-5, the three-electrode setup forms a standard cell test system that consists of a working electrode (WE) which is the single electrode, a Hg/HgO reference electrode (RE) and a platinum counter electrode (CE). The counter electrode always changes the polarity opposite to WE and ensures the current going through between WE and CE. Reference electrode should be an electrode which has a stable and known potential providing a benchmark to calculate the potential on working electrode.
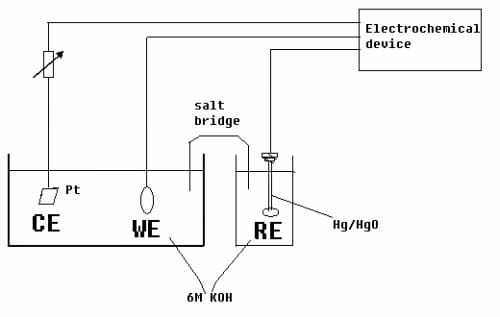
Figure 4- 5 Schematic of the three-electrode cell test system
4.3.3 Two- Electrodes Cell for Capacitance Measurement
After the three electrodes are prepared, they are immersed in electrolyte and connected with the Solartron electrochemical analyzer. Finally, the WE/CE and RE are closed by a salt bridge and the system is ready for testing.
The whole capacitor cell, on the other hand, is more resistant to these physical changes due to its design, and is more suitable for long term tests. In terms of structure, it is also closer to the intended product-a EDLC.
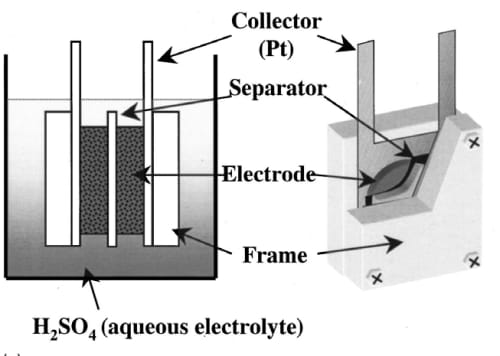
Figure 4- 6 Schematic of a whole capacitor cell test system (Endo et al., 2001)
From Figure 4-6, we can see that the cell structure is symmetrical. Two pieces of current collectors, two pieces of porous carbon layer and a separator to divide these two parts were sandwiched between two frames. By tightening the screws in the four corners, the whole structure was kept stable and each component contacted with each other tightly. The whole cell is immersed in electrolyte when being tested.
4.3.4 Cyclic Voltammetry (CV) and Constant Current Charge/Discharge (CD)
By using the “cyclic voltammogram” in Corrware, the electrode or capacitor cell can be tested. Following is the procedure of CV tests.
- Choose desired potential range (such as -1.0 to 0.2 V) and scan rate (such as 10mV/s). The potential range is selected vs. “Reference” which means an exact potential to be applied.
- Set data collection frequency which is set as N mV/point (N = any number to input, such as 10mV/point which means recording a data point per 10mV), while larger N means less data points recorded.
- Select number of cycles and which cycle to be recorded.
- Give file data file name and choose the folder to place the date files.
- Start measurements by clicking the “measure” icon.
- When the experiment is completed, the CV curve is displayed in the windows, normally as X-potential range (V) vs. Y-current (Amps) plots.
The “Galvanic Cycling” is used to perform multiple cycles of constant current charge/discharge test. The interface of all the programs in Corrware is similar to that of CV tests. The procedure of CD tests is given as follows,
- Input constant value of current.
- The voltage range is restricted by selecting Max E (V) and Min E (V).
- Select the time for charge or discharge (such as 10 s). If comparing CD with CV test, the charge or discharge time should be equal to half of the time for one cycle of CV.
- Similarly, the frequency of data collection (i.e. density of data points) can be set as N points/sec (such as 10points/sec).
- Select number of cycles and which cycle to be recorded.
- When the experiment is completed, the CD-profile is displayed in the windows normally as X-charge/discharge time (s) vs. Y-voltage (V) plots.
5. Results and Discussion
5.1 Characteristics of Electrode Materials
5.1.1 Specific Surface Area and Pore Size Distribution
As we know, specific surface area and pore size distribution are important properties for charge storage, so it is necessary to measure them before starting all the experiments. Table 5-1 shows that the SSA decreased slightly after the porous carbon layer was made. Also, the SSA of the tire residue is small compared to that of the activated carbon; therefore it may be concluded that the surface area available for charge storage would mainly come from the activated carbon. According to the general standard, pores with diameters less than 2 nm are classified as micropores, those with diameters between 2-50 nm are mesopores, and those with diameters larger than 50nm are macropores. Hence for this activated carbon, the percentage of mesopores and macropores are approximately 80% which is very high for an activated carbon with an SSA of close to 2000 m2/g.T-plot surface area represents for the total surface area of mesopores and macropores while BET method provides total surface area which have been discussed in Section 4.1.1. Unlike micropores, the diffusion resistance in mesopores is not a serious problem. Unlike macropores it is possible to achieve a high surface area without compromising the structural integrity of the sample. Therefore it is believed that a high percentage of mesopore is desirable. (Qu et al., 2002; Li et al, 2006; Xing et al., 2006)
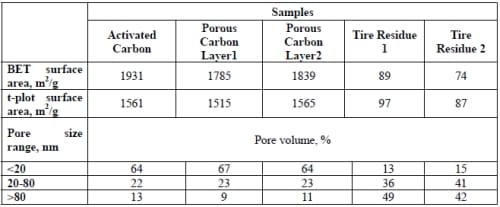
Table 5- 1 Comparison of Specific surface area (SSA) and pore size distribution (PSD) of activated carbon (K-PN-900C-2.5h-R2.0), tire residue and porous carbon layer.
5.1.2 Morphology
Scanning Electron Microscopy is used to provide images with detailed information about the morphology of the carbon material and porous carbon film. From Figure 5-1(a), it is observed that the activated carbon particle is large (~ 100 µm) and has a layered structure attributable to the coking process in which the particle was produced. Figure 5-1(b) provides more details of the activated carbon texture, showing some cracks. However, the large SSA is likely due to much thinner graphene layers which are not visible in this SEM picture of limited magnification (× 300K).
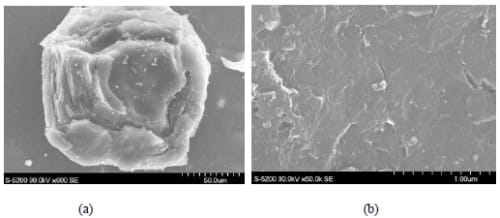
Figure 5- 1 SEM images of a fluid coke derived activated carbon particle (K-PN-900C-2.5h-R2.0) (a) cross-section (b) internal structure.
Figure 5-2 is an SEM picture of the tire residue, showing a collection of very small (~ 50 nm in diameter) particles loosely attached to each other, very different from the activated carbon particles. Given their small SSA (< 100 m2/g), these particles are likely nonporous. It was observed that adding tire residue to the activated carbon eases the process of making carbon film. Apparently, these small particles were able to help connect the much larger particles of activated carbon.
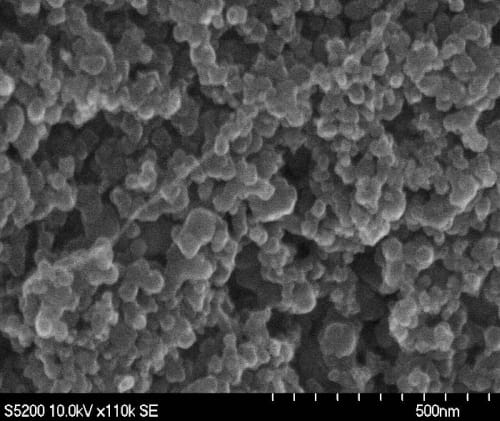
Figure 5- 2 SEM image of tire residue particle
Figure 5-3 illustrates the surface morphology of carbon film in which the particles of activated carbon and tire residue are combined by PTFE. The lighter parts in the picture are likely PTFE which forms a network helping bind these particles.
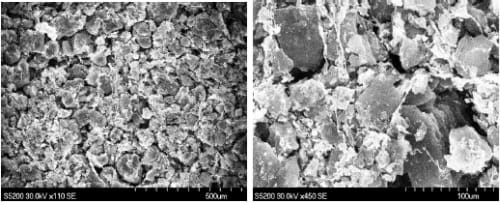
Figure 5- 3 SEM images of surface of carbon film
5.1.3 Conductivity
Conductivity/resistivity of electrode material is studied to determine how much of the total resistance within the whole system is from the electrode material. Higher conductivity i.e. lower resistance is desired due to the better performance such as electron transfer during charge/discharge process.
The activated carbon was used to make porous carbon film with the same formula of 90:6:4% and was tested using up to a 1 cm path length. For comparison, the same procedure was applied to a commercial activated carbon derived from coconut shell. As shown in Figure 5-4, the resistance increased with length which is expected and consistent with the equation (5-1) for resistance:
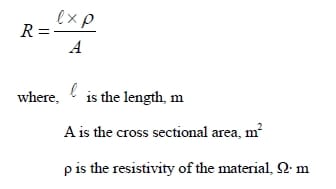
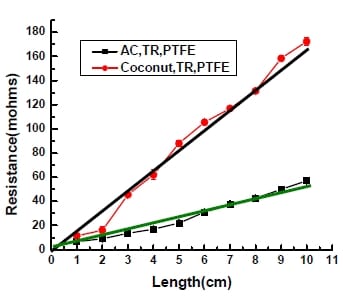
Figure 5- 4 Effect of length on resistance of electrode materials made by activated carbon (red dot) and commercial coconut material (black dot).Two straight line (black and green) across zero point are theore
tical lines.
It is also noted that the coke derived carbon had a much lower resistance than the coconut shell derived carbon. Based on the experimental data from Figure 5-4, the resistivity of electrode material made with the coke derived activated carbon is approximately 1.05×10⁻⁵ Ωm, while that of commercial coconut activated carbon is about 3.19×10⁻⁵ Ωm. The reported resistivity of different carbon species ranges from 3.5×10⁻⁵ of amorphous carbon to 7.837×10⁻⁶ Ωm of graphite (Fink, 2000; Espinola et al., 1986).
5.1.4 Wettability
Since surface wettability of the electrode material is important for ensuring all of the pores contact electrolyte for charge storage, wettability is investigated as an important property. A droplet of KOH electrolyte was manually placed onto the surface of porous carbon film using a pipette at a fixed height above the film. Images were taken to determine the time needed for electrolyte to thoroughly penetrate into the electrode material. After one hour, the electrolyte (6 M KOH) completely penetrated the porous carbon layer at room temperature, suggesting that for the activated carbon studied the wettability may not be a significant factor that hinders the performance of the electrode material.
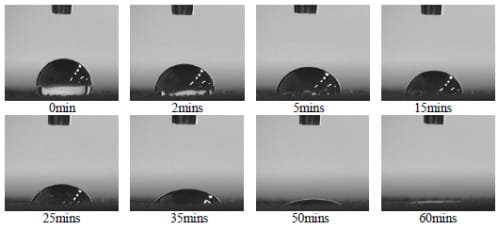
Figure 5- 5 Images of process for KOH electrolyte penetrating into porous carbon film
5.2 Construction of Electrodes
In order to test the electrode material, an electrode with a stable structure must be fabricated and is essential to providing repeatable results. An ideal single electrode should be mechanically strong and yet electrically conductive. Therefore, carbon particles should be bound into stable matrix with minimum non-conductive material such as polymer binder. A hydrophilic surface is desirable so that aqueous electrolyte can easily penetrate into pores of the electrode material. A tight contact between the electrode material and the current collector is necessary, for which a large contact area and external pressure would be helpful. Overall, the electrode has to be structurally stable to ensure the repeatability of electrochemical measurements.
5.2.1 Components of Electrode Materials
The main active electrode material is the fluid coke derived activated carbon, which is the focus of this investigation. As a conductive material, the tire residue is added to lower the resistibility of the electrode material, although graphite is also used by some researchers (Yang et al., 2005; Li et al., 2008; Wei et al., 2005).
To test the effectiveness of tire residue, its performance is compared with that of graphite (Aldrich, fine powder of particle size <20µm). The measure of performance is sample capacitance. The details of capacitance measurement are discussed later but the comparison of tire residue and graphite is provided here to show the benefit of the additive.
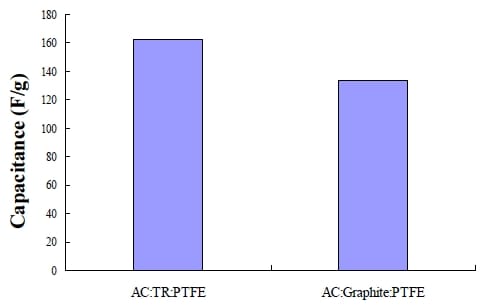
Figure 5- 6 Effect of conductive material on capacitance. (both of the samples are the same formula:90:6:4wt%)
From Figure 5-6, it is notable that electrode material with tire residue has around 20F/g higher capacitance than with graphite. The higher SSA of tire residue (shown in Table 5-1) might contribute to the storage of charge as well. Meanwhile, the particle size of graphite is smaller than tire residue whose structure is porous which may block some of the AC pores. Due to these two reasons, tire residue which also has good conductivity and is produced from a waste (i.e. should be economical) become our choice.
Due to the non-conductive nature of PTFE binder, the amount of PTFE added should be limited such that it can bind the particles to stabilize the matrix but still leave the electrode material as conductive as possible. By using the resistance testing method described in Section 4.1.4 and calculation method in 5.1.3, electrode material made from five different contents of PTFE 4%, 6%,10%, 20%,40%, is tested separately. The results in Figure 5-7 suggest that higher the PTFE content, the higher the resistance of the electrode material. The need to minimize the amount of PTFE is therefore clear. Following the procedure described in Section 4.2.1, 4% of PTFE was found to be sufficient, which is the lowest amount of PTFE reported in the literature (Park et al., 2002; Ramani et al., 2001; Wei et al., 2005).
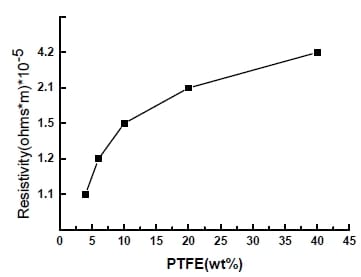
Figure 5- 7 Effect of PTFE (binder) on resistivity of electrode material (TR = 4%).
5.2.2 Selection of Current Collector
The material of the current collector should be non-corroding in the chosen electrolyte and within the test range. Nickel foil is essentially a metal material that cannot store charge, but can be quite resistant to the KOH electrolyte. To ensure the suitability of Ni, CV tests were carried out in two potential ranges in 6 M KOH solution: – 1.0 to 0.2 V and 0.2 to 0.7 V.
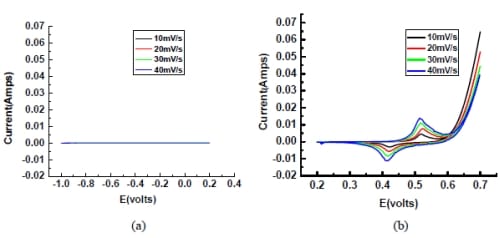
Figure 5- 8 Cyclic Voltammogram of nickel foil at different potential range (a) -1.0-0.2 V (b) 0.2-0.8V, in 6M KOH solution at different scan rate. (vs.Hg/HgO/6M KOH) nickel foil area = 5cm2.
Graph 5-8(a) is a straight line showing metal behavior without any charge stored, while (b) shows peaks suggesting redox reactions with potassium hydroxide around 0.4-0.5V. This suggests that that nickel shouldn’t have any effect on CV measurement within -1.0 to 0.2 V.
As shown in Figure 5-9, the single electrode made from nickel foil shows almost no capacitance according to the CV results, regardless scanning rate, suggesting that nickel foil is a suitable current collector but with poor contact due to the smooth surface. The slope may be attributed to the contact resistance between electrode material and nickel foil.
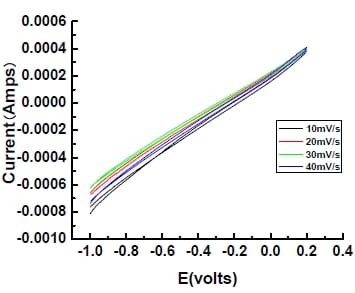
Figure 5- 9 Observed cyclic voltammogram of a single electrode made with the electrode material and nickel foil at different scan rates. Potential range:-1.0-0.2V (vs.Hg/HgO/6M KOH).Electrode area=3.4cm2
To solve this problem, two types of nickel mesh (Alfa Aesar, 40 mesh, 64% open area and 100 mesh, 36% open area) were used to make electrodes. The results of CV for electrodes fabricated with porous carbon layer and two kinds of nickel meshes are given in Figures 5-10 and 5-11.
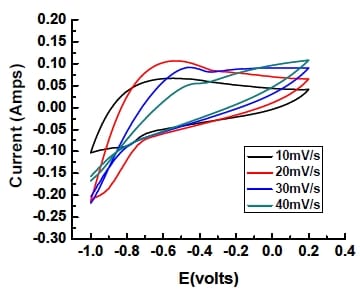
Figure 5- 10 Cyclic Voltammogram of electrodes made with 40 mesh nickel mesh in 6M KOH solution at different scan rates. Potential range:-1.0- 0.2V (vs.Hg/HgO/6M KOH) Electrode area=3.4cm2
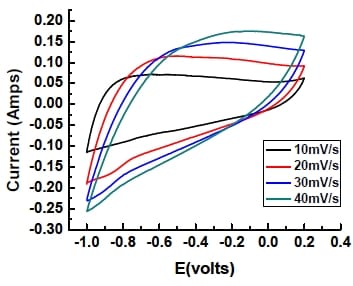
Figure 5- 11 Cyclic Voltammogram of electrodes made with 100 mesh nickel mesh in 6M KOH solution at different scan rates. Potential range:-1.0- 0.2V (vs.Hg/HgO/6M KOH) Electrode area=3.4cm2
The electrodes made with 100 mesh nickel mesh gave a greater area within the CV curve, i.e. a greater capacitance, and was chosen as the current collector in future experiments. The poor performance observed with nickel foil is therefore attributed to the poor contact between the active electrode material and the current collector. Some literature has shown that the contact resistance greatly affects the performance of capacitor which is measured by the capacitance (Hahn et al., 2001; Zheng, 2004).
5.2.3 Determina
tion of System Resistances
As mentioned in Section 2.3.4, the overall internal resistance within the system comes from different parts of an electrode. To understand the relative contribution of other parts to the overall resistance, other components were examined.
Aqueous electrolyte used in this study is 6M KOH. Its conductivity at 20°C is reported to be 0.5697 S/cm (Gilliam et al., 2007). The resistivity (?) is the reciprocal of conductivity (σ), so p = 1/σ = 1.76×10⁻² Ωm, which is three orders of magnitude higher than the resistivity of the electrode material based on the fluid coke derived activated carbon, but is lower than that of organic electrolytes (~ 20 ×10-2 to 60 × 10-2 Ωm) (Burke, 2000).
During experiments the electrode is always immersed in the KOH electrolyte which has a much higher resistance than the electrode material. Therefore, the total resistance of electrode material and electrolyte was tested and compared to samples without the KOH electrolyte. From Figure 5-12, it is clear that KOH greatly increased the resistance. The calculated total resistivity of the electrode material with electrolyte KOH is 1.59×10⁻⁴ Ωm, which is one order of magnitude higher than the electrode material alone (~1.05×10⁻⁵ Ωm). This result suggests that the electrolyte was able to separate the particles that were initially connected. KOH electrolyte contributed much more to the overall resistance than the carbon material, suggesting that adding TR may not be necessary in terms of improving conductivity of the active material. Conductivity of the active carbon material may be even less important if an ionic liquid is used as the electrolyte because resistance of electrolyte is two or three magnitude higher than the carbon material.
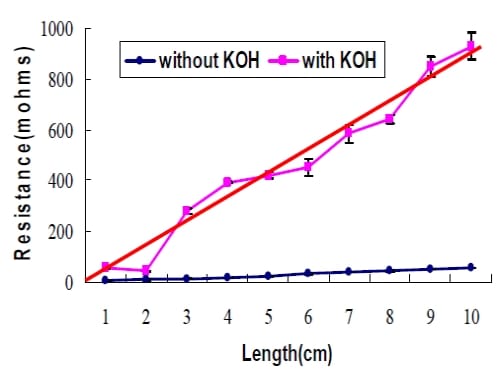
Figure 5- 12 Effect of length on resistances of electrode materials with KOH electrolyte (purple dot) and without KOH (blue dot) and theoretical line (red line).Cross-section area=0.02cm2
In order to determine the influence of contact between porous carbon film and current collector on total resistance, a hydraulic pressure machine was used. 20 MPa pressure was applied for 5 minutes to press the carbon film onto the nickel mesh. Then, a single electrode is assembled, tested, and compared to electrode made without the pressing step. Figure 5-13 shows the results.
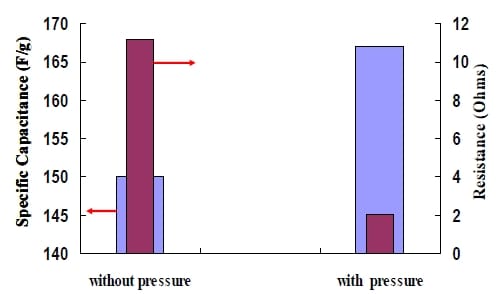
Figure 5- 13 Effect of pressure on contact resistance and capacitance
Based on the IR drop on the CD curves, the overall resistance of the single electrode made with the pressing step is 2.08Ω, much smaller than that of the one without the pressing step (11.21 Ω). Applying pressure can improve the contact between electrode material and current collector, consequently decrease the contact resistance. Moreover, the contact resistance takes up a large percentage of the total resistance.
5.3 Operation Conditions of Cyclic Voltammetry Measurements
5.3.1 Effect of Potential Range
Aqueous electrolytes generally have lower resistance than their non-aqueous counterparts, such as organic electrolyte. However, due to the hydrolysis of water, the cell voltage is normally limited to maximum of 1.2 V (Hahn et al., 2001). Different potential ranges were tested for this specific system to find the optimal potential range for quantifying capacitance.
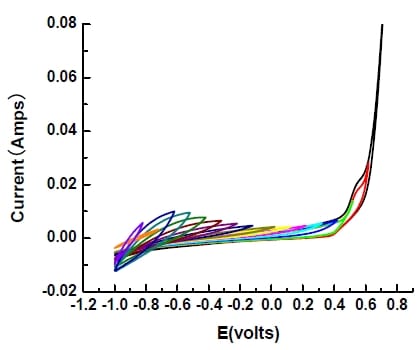
Figure 5- 14 Cyclic Voltammogram of single electrode (AC: tire residue: PTFE=90:6:4%) in 6 M KOH solution within different potential ranges at 10 mV/s. Overall potential range:-1.0- 0.8V (vs.Hg/HgO/6M KOH) Electrode area=3.4cm2
Figure 5-14 shows the curves at different potential ranges with 0.1 V intervals, the sharp increase or decrease of the curves illustrate that at above 0.2 V oxygen evolution appears. Evolution also occurs for hydrogen at below –1.0 V. Therefore, the proper potential range for the electrode in 6M KOH electrolyte is – 1.0 and 0.2 V.
5.3.2 Selection of Counter Electrodes
A counter electrode always changes its polarity such that it is opposite to the working electrode. The function of counter electrode is to ensure that the current is restricted to the region between the working and counter electrode, and so that no current is required to be passed through the reference electrode. The surface area of counter electrodes should be much larger than that of working electrode to avoid excessive polarization which may exceed the voltage requirements of the device and restrict the reactions occurring on the working electrode.
Since platinum (Pt) is very expensive, other materials with a large surface area were used. A 1-layer nickel screen, 3-layer nickel screen, carbon electrode and a Pt screen electrode were tested respectively and compared as follows:
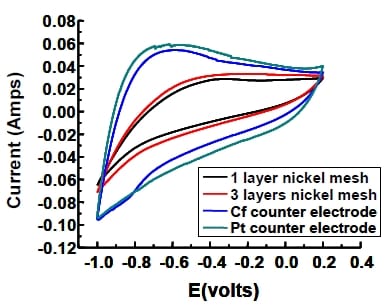
Figure 5- 15 Comparison of cyclic voltammogram of single electrode with different counter electrodes in 6M KOH solution at scan rate of 30 mV/s. (vs.Hg/HgO/6M KOH).3.4cm2 for the working electrode area
The surface area available for charge storage of working electrode is roughly S=2000m2/g x 0.04g=80m2, while one layer nickel mesh has around 400cm2 and Pt mesh is approximately 0.5cm2. Thus, by comparing them, it is clear that WE has at least 2000 times higher surface area, which represents a real challenge in finding a suitable counter electrode.
The results shown in Figure 5-15 indicate that the Pt electrode gave the largest area in a cyclic voltammogram. Three layers nickel mesh slightly increased the capacitance compared to the single layer electrode, but the porous carbon counter electrode with much larger innate surface area resulted in an even greater area. Thus, it is concluded that even though the surface area of counter electrode is important, the effect of electrode materials should also be considered. Platinum is the most conductive material within these three alternatives.
5.4 Stability of Single Electrode
During the experiment, a gradual decay of the electrode was observed with small pieces of carbon films found to fall off into the electrolyte. Some of the carbon film was detached with potential cycling from the nickel mesh. Figure 5-16 is cyclic voltammogram of single electrode after number of cycles. The figure shows a decrease in the area between the curves (which is proportional to the capacitance and hence active electrode area) with the increase in the number of cycles, suggesting that the physical destruction of electrode did affect its performance negatively. This is expected since the detachment between porous carbon film and nickel mesh would reduce the amount of active carbon material due to the fall off, and it may also allow the electrolyte to get into the gap and increase contact resistance.
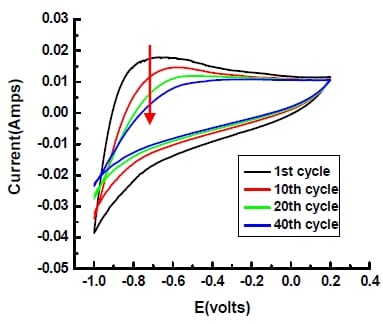
Figure 5- 16 Cyclic Voltammogram of single electrode after different time periods in 6M KOH solution at 10mV/s. Potential range:-1.0-0.2 V (vs.Hg/HgO/6M KOH) Electrode area=3.4cm2
5.5 Construction of a Capacitor Cell
Even though the contact with the active carbon can be enhanced by using nickel mesh instead of nickel foil, the problem of detachment persisted (see Figure 5-16), especially after a long period of running. To avoid the detachment, a capacitor cell consisting of two electrodes was designed, in which
a constant pressure was applied to both electrodes to keep them tightly in contact with the current collectors.
By placing pressure sensor paper into the cell and immersing it into electrolyte for around 2hours,the pressure (bolt torque) required by the 4 bolts to provide a uniform contact was determined. A capacitor cell with relatively constant contact pressure and more stable structure was ready at this stage to be tested.
Table 5-2 shows two sets of capacitance and resistance data. One set is the results of a capacitor cell assembled without pressure sensor paper while the other set is with sensor paper. By using the pressure paper, assembly of cell can be improved in terms of uniform and relatively consistent contact pressure between carbon layer and nickel mesh.
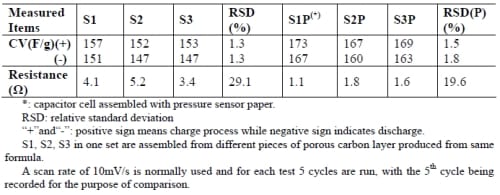
Table 5- 2 Comparison of capacitance and resistance of samples with and without pressure sensor paper.
From Table 5-2, it is clear that less than 2% RSD of capacitance indicated good repeatability of construction of capacitor cell no matter with or without pressure sensor paper. However, capacitor cell made with pressure sensor paper provided relatively consistent (19.6%) and lower resistance while the capacitance is higher due to the better contact. It is consistent with results from Figure 5-13. Meanwhile, there is a difference between the capacitance measured during the charge and discharge process. The charge capacitance is constantly larger than the discharge capacitance, which has been observed by other researchers but without any explanation (Yang et al, 2005). It is thought that the smaller discharge capacitance might be due to the current leakage.
Therefore, it is concluded that the use of pressure paper improves the consistent contact between electrode material and current collector and as a result improves performance of capacitor .Reducing the contact resistance is the most significant issue to pay attention to when fabricating single electrodes as well as capacitor cells.
5.6 Performance of Capacitor Cell
5.6.1 Determination of Suitable Potential Range
Cyclic voltammograms for the capacitor cell at different terminal potentials are given in Figure 5-17. A capacitor cell or even commercial capacitor are always tested above 0 V, so the largest potential range beyond 0V to avoid water decomposition should be determined in order to get the best performance.
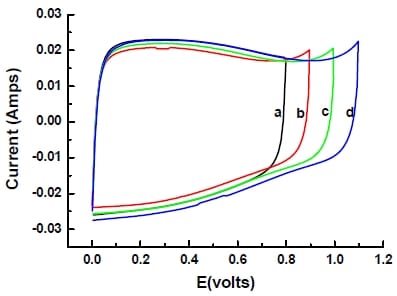
Figure 5- 17 Cyclic voltammograms for a capacitor cell in 6M KOH solution at different terminal potentials at a scan rate of 10 mV/s: (a) 0-0.8V (black); (b) 0-0.9V (red); (c) 0-1V (green); (d) 0-1.1V (blue). Electrode area=3.4cm2
Thus, from the above graph, at a terminal potential of 0.8, the CV is rather stable without any visible peaks indicating gas evolution and any significant distortion of the curve. In conclusion, the useful potential window is from 0 to 0.8 V which will be the range used in characterizing capacitor cell.
5.6.2 Capacitance Measurement with Cyclic Voltammetry (CV)
The two-electrode system is used to evaluate the performance of capacitor cell. To validate the method, a commercial double layer capacitor (Maxwell, 140F) was tested and the results shown in Figure 5-18.
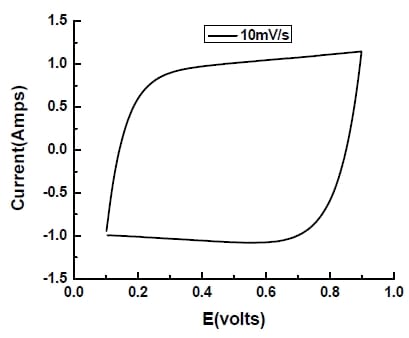
Figure 5- 18 Cyclic voltammogram of a commercial capacitor at scan rate of 10mV/s.
From the graph above, the shape of CV curve is similar to rectangle. The calculated capacitance is 110F, close to but lower than the one specified by the manufacturer.
Applying the same procedure, a capacitor cell assembled with the same porous carbon layer used for the single electrode was evaluated. The results are shown in Figure 5-19.
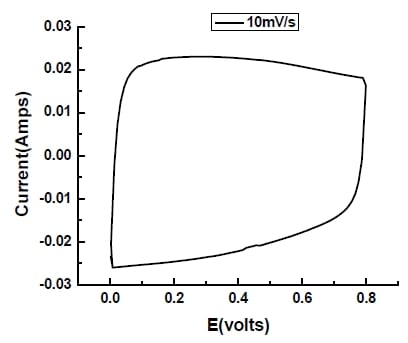
Figure 5- 19 Cyclic voltammogram of a capacitor cell made with fluid coke derived activated carbon at scan rate of 10 mV/s. Electrode area=3.4cm2
Comparing Figure 5-19 with CVs of single electrode (such as Figure 5-11), it is observed that the capacitor cell showed a more symmetrical response than a single electrode; (i.e. the shape of the CV of the capacitor cell is closer to a rectangle). However, there seems a hump between 0.2 to 0.4V which is likely due to the pseudocapacitance from the impurities or surface functional groups (Hahn et al., 2001). The specific capacitance calculated is 164F/g which is comparable with a maximum capacitance of 160F/g prepared from subbituminous coal derived activated carbon at very low scan rate of 1mV/s (Gryglewicz et al., 2005).
5.6.3 Effect of Heat Pretreatment on Capacitance
In order to better understand the effect of impurities or surface functional groups on the electrochemical double layer capacitor behavior, and to potentially improve the performance of the capacitor, activated carbon particles are pretreated at 900°C under N2 for 4 hours (for details see Section 4.1.2). A capacitor cell was made with the pretreated carbon material and evaluated using the same two electrode system. The cyclic voltammogram of the capacitor cell is shown in Figure 5-20, along with that of the one without pretreatment.
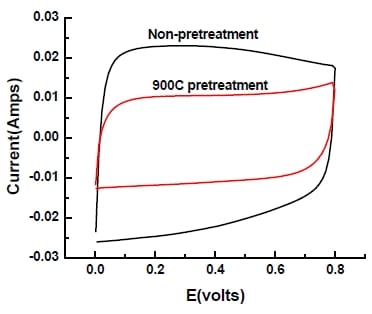
Figure 5- 20 Comparison of Cyclic Voltammogram of capacitor cell with pretreatment (in black) and without (in red) in 6M KOH solution at 10mV/s. Potential range: 0-0.8V. Electrode area=3.4cm2.
Apparently, with heat pretreatment, the shape of the curve is more rectangular but with smaller area. The hump has been removed, supporting the hypothesis that the hump was due to impurities that are electrochemically active. The reduced area suggests a reduced capacitance which is calculated to be 110F/g, 32% lower than the one without heat treatment. Specific surface area of the heat-treated activated carbon was determined to be 20% lower than the one without heat treatment. By calculating capacitance based on BET surface area, 854F/cm2 and 712 F/cm2 were obtained for non-pretreated and 900°C pretreated sample. If the specific double layer capacitance is directly proportional to the SSA of the electrode material, capacitance based on BET surface area should keep constant. Thus, the additional reduction in specific capacitance after the heat treatment may be attributed to the removal of pseudocapacitance.
5.6.4 Capacitance Measurement with Constant Current Charge/ Discharge
Another technique, constant current charge/discharge, can be used to evaluate capacitance as well as internal resistance. To validate the test method, the same Maxwell double layer capacitor as used in the CV test was first tested at the same scan rate of 10 mV/s. The results are shown in Figure 5-21(a) and (b) where the slope of the CD curve represents the scan rate of around 10mV/s and the sharp voltage drop shows the IR drop. Data in Figure 5-21(a) appears to be stepped due to the large amount of recorded data which can not be properly shown in the small scale. Thus, if one cycle is enlarged in Figure 5-21(b), the line appears to be smooth. The different behaviour of the first cycle (same as CV) is always due to the initial starting point and the whole system needs time to reach a steady-state behaviour.
The capacitance obtained from the charge/discharge method is about 102 F. This is lower than one specified by the manufacturer (140 F) and slightly lower than the CV result (110 F). Based on the voltage drop, internal resistance of the commercial capacitor is calculated to be approximately 80 mO, whic
h is consistent with the reported data (76 mO) from the manufacturer.
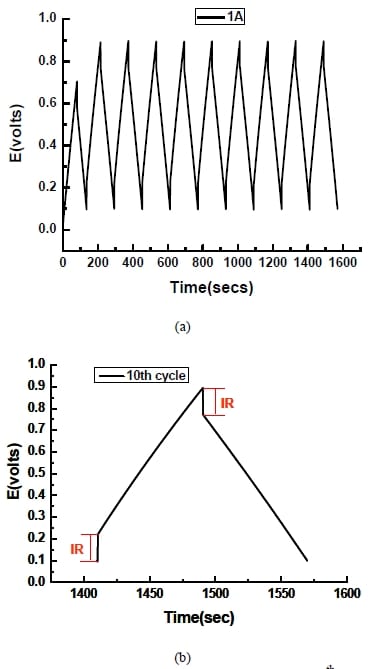
Figure 5- 21 Charge/discharge curve of (a)10 cycles;(b) enlarged 10th cycle of a commercial capacitor (Maxwell, 140F) at current of 1A.
The same method was applied to the same capacitor cell made with the fluid coke derived activated carbon, and the results are given in Figure 5-22. During the test, 20 mA was used as the average current, consistent with the CV measurement. The potential range was kept between 0 and 0.8V, the same as the CV measurement. The purpose for keeping these parameters constant is to determine if the capacitance values from these two methods are comparable. However, the capacitance determined using the CD method at 10mV/s was 150F/g which is smaller than the one obtained with the CV method (164 F/g).The possible cause of the discrepancy will be discussed in Section 5.7.
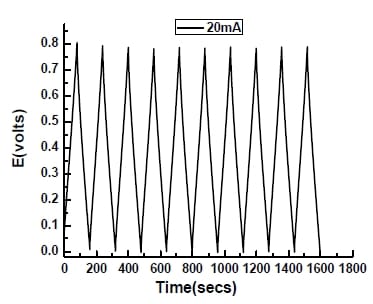
Figure 5- 22 Charge/discharge curves of a capacitor cell made with the fluid coke derived activated carbon at current of 20mA.
5.6.5 Stability of Capacitor Cell
From Section 4.7, it was found that the single electrode could experience degradation after a few tens of cycles. It is expected that the capacitor cell will have a longer cycle life due to its structural integrity. Figure 5-23 shows the CVs of a capacitor cell up to 1000 cycles. Apparently, the capacitor cell was quite stable over these 1000 cycles. The calculated capacitance for the 1st and the 1000th cycles are 164 F/g and 152 F/g, respectively. The decrease (~7%) may be attributed to the removal of electrochemically active substances. The capacitor cell structure substantially improves the stability compared to the single electrode where 15% decrease in capacitance was recorded after 40 cycles.
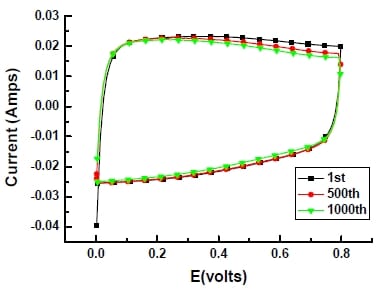
Figure 5- 23 Stability of capacitor cell up to 1000 cycles. (Electrode area=3.4cm2)
5.7 Understanding the Measurement of Capacitance
Capacitance is a measure of the amount of electric charge stored (or separated) for a given electric potential. For a double-plate charge storage device, if the charges on the plates are +Q and -Q in coulombs, and V is the voltage difference between the plates, then the capacitance is given by
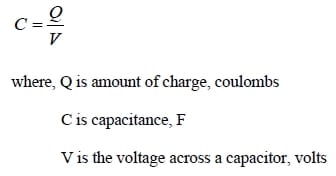
The SI unit of capacitance is farad; 1 farad = 1 coulomb per volt. Although the definition of capacitance is simple for a double-plate capacitor, the evaluation of capacitance of electrochemical double layer capacitors is not trivial, particularly when it involves pseudocapacitance. The values reported in literature are often unique to the methods used, the conditions of measurements and even the judgement of the researchers. Consequently, the comparison between values reported by different researchers is difficult. In this section, efforts are made to better understand the measurement of capacitance and to devise a procedure for proper evaluating and reporting capacitance values.
5.7.1 Intrinsic Capacitance (CI), Measured Capacitance (CM) and Corrected Capacitance(CC)
To better understand the concept of capacitance and its measurement, there is a need to better define capacitance. The first term introduced is “intrinsic capacitance” (CI) which is a property of the capacitor system that only depends on the electrode material and the electrolyte as well as the dimension of the cell. It is the maximum value of capacitance that a capacitor system may have and is not affected by the method by which it is measured and by the condition how it is measured (such as scan rate). It is a measure of theoretical capacity of a capacitor to store charge. For electrochemical double layer capacitors it includes both pure double layer capacitance and pseudocapacitance which comes from the surface functional group or impurities within the electrolyte.
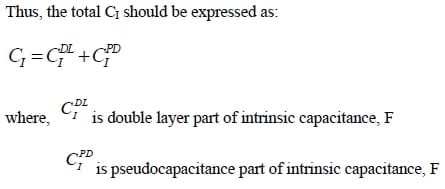
However, DL capacitance and pseudocapacitance cannot be distinguished based on the current knowledge.
Measured capacitance (CM) is the capacitance obtained directly from CV or CD experimental data which depends on the experimental conditions such as resistance and scan rate. Since the charge/discharge process is dynamic and involves multiple transport processes, CM should be always smaller than CI. In other words, CI may not be measurable.
Measured capacitance is always calculated by integrating the CV curve to get the average current value, and by applying equations in Section 2.1.3 to obtain the average capacitance. This method is widely used and accepted by the research community (Gryglewicz et al., 2005; Yang et al., 2005).
It is known that some properties of capacitors such as internal resistance affect the performance of capacitor as well as the measured value of capacitance. It is sometimes possible to correct the measured value if the relationship between the property involved and capacitance is known, such as the case with internal resistance where the corrected capacitance (CC) is greater than CM. Figure 5-24 illustrates the conceptual relationship among three capacitances defined here and their dependence on scan rate which will be discussed later.
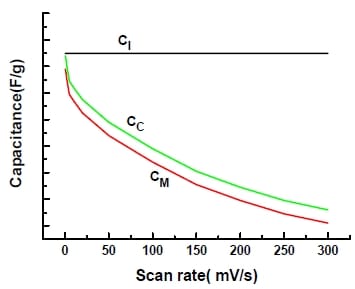
Figure 5- 24 Conceptual relationship among intrinsic capacitance, measured capacitance and corrected capacitance.
As shown in Figure 5-24, the conceptual relationship shows CI < CC < CM. All the capacitance values so far in this thesis are CC. In the following sections, the effects of scan rate and internal resistance on the evaluation of capacitance are discussed.
5.7.2 Dependence of Measured Capacitance on Scan Rate
Figure 5-25 gives the CV curves of a capacitor cell with KOH electrolyte at different scan rates (2 to 300 mV/s). From Figure 5-25, it is noted that the shape of CV curves strongly depends on the scan rate. Lower scan rates result in CV curves that are more rectangular. At 100 mV/s, the CV curve is still quite rectangular with little tilting, suggesting that the capacitor cell can exhibit high rate capability (Yang et al., 2005; Xing et al., 2006).
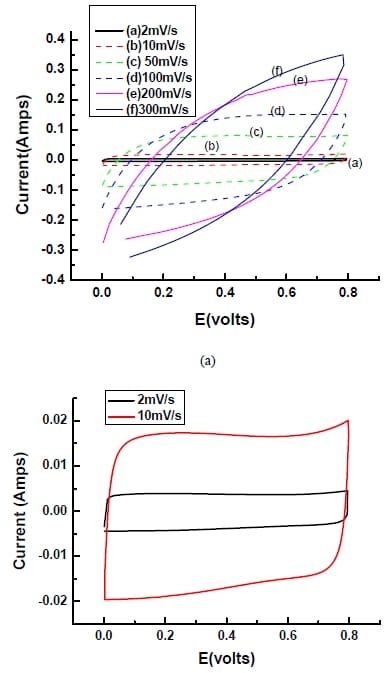
Figure 5- 25 CV curves for capacitor cell with KOH electrolyte at (a) different scan rates from 2 to 300mV/s. (b) Magnified graph of 2mV/s and 10mV/s.
The rectangular shape suggests an unrestricted transport of electrolytes in the AC pores with the slow formation of double layer (Liu et al., 2005). Tilting is an indicator of substantial internal resistance and it became significant when the scan rate was 200 mV/s or higher as shown in Figure 5-25. With the increase of scan rate, the ohmic resistance of electrolyte migration in the pores increases, leading to a smaller measured capacitance (Liu et al., 2005).
Figure 5-26(a) shows the dependence of capacitance measured with CV and CD methods on the scan rate. The charge/discharge time used for CV and CD tests was the same. In CD tests, the voltage range was restricted within 0-0.8V so that the same scan rate was used. Although in both cases the measured capacitance decreased with the scan rate, the CV-based capacitance seemed slightly more sensitive to the change in scan r
ate than the CD-based capacitance.
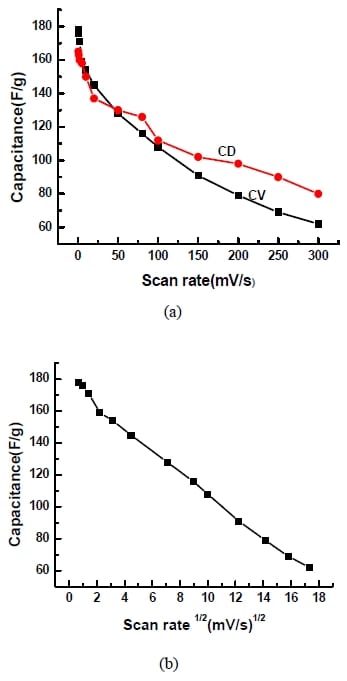
Figure 5- 26(a) Effect of scan rate on charge capacitance of CV and CD; (b) Capacitance vs. scan rate1/2 curves based on original CV data for capacitor cell in KOH electrolyte.
Consequently, at low scan rates the CV method tends to yield a larger CM than the CD method, while at high scan rates it gives a smaller one. It is believed that slowing down the scan rate can allow electrolyte to penetrate into pores more thoroughly and to make greater contact with the internal surface of the electrode material, and hence yield a larger measured capacitance that is closer to the intrinsic capacitance.
The strong and complicated dependence of CM on scan rate suggests that any reported CM must be accompanied by the scan rate and the method used.
By plotting capacitance against square root of scan rate, Figure 5-26(b) was obtained and shown above. It is notable that at scan rate1/2 ≥ 2.2 (mV/s)1/2, a linear dependence of capacitance on scan rate1/2 is notable which indicated the characteristic of the diffusion controlled (adsorption limited) process. It is caused by the small values of the diffusion coefficients of the electrolyte ions in the pores. Thus, from here we can see important effect of pore size and the size of electrolyte ions on capacitive behavior (Lust et al., 2003).
5.7.3 Resistance Compensation on Measured Capacitance
Every capacitor has internal resistance (IR) which has to be minimized to enhance the performance of the capacitor. In principle, cyclic voltammetry (CV) and constant current charge/discharge (CD) are the same technique, and share the same equations for calculating capacitance. However, when calculating capacitance from the CD curve, the voltage drop (also called IR drop) at the change of charge to discharge indicates internal resistance is excluded from the rest of the curve, but the calculation of the CV based capacity uses the entire curve that includes the IR effect As shown in Figure 5-27, a capacitor may be treated as a pure capacitor and a resistor connected in series. Thus, the potential value recorded in a CV test consists of the potential for the capacitor (Vc) and the resistor (VR). As capacitance is a property of the capacitor only, it should be calculated based on the voltage of the pure capacitor, Vc. If the VR is known from the measured I and resistance R, then Vc can be determined based on the measured potential V.
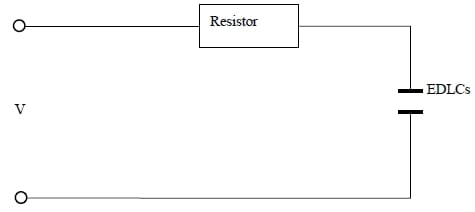
Figure 5- 27 Schematic of a real capacitor – a pure capacitor and a resistor in series.
Likewise, the scan rate experienced by the pure capacitor is dVc/dt which is smaller than the applied scan rate, dV/dt. Following equations are used to calculate the corrected capacitance CC.
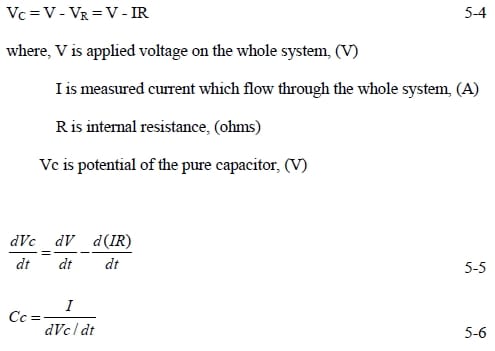
The corrected capacitance, Cc, should be larger than the capacitance directly calculated from experimental data. By using this new equation, an instantaneous Cc can be calculated for each data point. In Figure 5-28(a), the instantaneous capacitance, Cc, was plotted against the corrected potential, Vc, which illustrates how the capacitor behaves at the applied voltage. The negative sign on capacitance is just an indicator of the opposite direction of current during discharging. In Figure 5-28(b), by resistance compensation, corrected capacitances Cc for samples with pre-treatment or not were plotted against corrected potential range Vc to compare the real capacitive behavior.
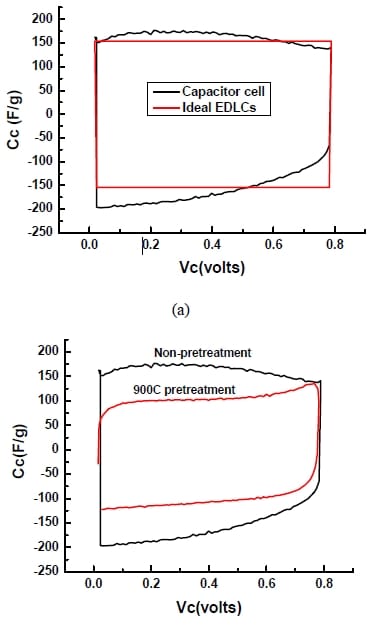
Figure 5- 28 (a)Relationship between corrected capacitance (Cc) and corrected potential (Vc); (b)Comparison of corrected capacitance Cc vs. Vc with and without heat-pretreatment.
A pure double-layer capacitor would have a curve that is perfectly rectangular, symmetric to the zero Cc line. In a pure double-layer capacitor, during charging or discharging processes, the Cc should not change with Vc, and Cc for charging should be Cc for discharging. The curve in Figure 5-28 shows the tested capacitor was not a pure double-layer capacitor and it is feasible to obtain instantaneous Cc from each data point in the CV curve. These instantaneous Cc values reveal more detailed information about the electrochemical behaviour of the capacitor during charging and discharging which is different. As shown in Figure 5-28(a), the charging process has a less variable Cc than the discharging process. For example, the hump between 0.1-0.4 V during charging may suggest pseudocapacitance. It is feasible to quantify the departure from an ideal behaviour (rectangular Cc vs. Vc). The value may be used as an indirect measure of the contribution of pseudocapacitance to the overall capacitance. Meanwhile, from Figure 5-28(b), the curve of heat-treated sample is more rectangular and flatter, which again supports the assumption in Figure 5-20 that heat treatment reduces pseudocapacitance.
At present, the contribution of pseudocapacitance is estimated by calculating double-layer capacitance with assumed active surface area and then the extra capacitance is due to pseudocapacitance (Sugimoto et al., 2004) Moreover, the electrochemical response of the capacitor to charging seems quite different from that to discharging. It is not clear what has caused this difference. The internal resistance used for the correction was obtained from CD experiments.
The IR effect on Cc was investigated, and the results are shown in Figure 5-29. A series of resistances are assumed from 1 to 10 ohms. The assumed resistance multiply by measured current (I) can be taken as new IR to recalculate Cc by equation (5-4, 5-5, 5-6).
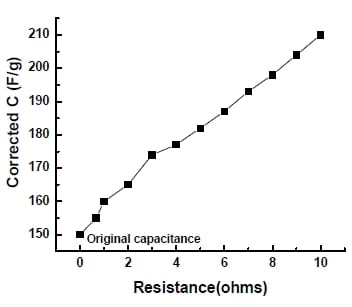
Figure 5- 29 Effect of resistance on corrected capacitance
From equation (5-5) and (5-6), one can see that with a larger resistance, the real scan rate dVc/dt is lower, which would lead to a higher Cc. Assuming a constant current, I, an overestimation of R by 1 ohm gives approximately 5 F/g increase of capacitance. The relationship between Cc and the internal resistance is consistent with the trend shown in Figure 5-29.
6. Conclusions
This work focused on the suitability of the fluid coke derived activated carbon as an electrode material in an electrochemical double layer capacitor (EDLC).
- The fluid coke derived activated carbon produced with a KOH chemical activation method is a suitable material as an active component of the electrode in EDCL. Using this material, the measured specific capacitance was able to reach 180 F/g at scan rate of 0.5mV/s. The suitability of this activated carbon is attributed to its high specific surface area (~1900 m2/g), high percentage of mesopores and macropores (~80%), low electrical resistivity (1.05×10⁻⁵ Ωm, slightly higher than that of graphite, 7.837×10⁻⁶Ωm), and relatively hydrophilic surface.
- Electrodes and capacitor cells were able to be fabricated with this carbon material using the procedures outlined in the thesis. It was found that 4 wt % of PTFE (a nonconductive binding material) could yield a mechanically stable electrode material. Tire residue, which is essentially a waste, was used successfully as a substitute for the more expensive black carbon. While easing the process of making electrodes, adding tire residue (6 wt%) didn’t lower the resistivity of the electrode material. The reason is likely due to the
already low resistivity of the activated carbon. - The use of a capacitor cell resulted in a substantial improvement in the electrode stability over that of single electrodes. After 1000 cycles, the drop in capacitance was about 7%, compared to the case of a single electrode where the capacitance decreased by 30% after about 40 cycles. The use of pressure paper improved the performance of the capacitor by allowing uniform pressure to be applied to the capacitor plates and improved the consistence of experimental data. With the pressure paper, the internal resistance was reduced by about 2Ω to and the capacitance increased by 10-20 F/g.
- Although electrode material, electrolyte and contact resistance were all contribute to internal resistance, contact resistance could be orders of magnitude higher than the other two factors. Minimizing contact resistance is essential to the performance of the capacitor, and contact resistance was reduced from 11Ω to 2Ω by using nickel mesh and applying pressure. The aqueous KOH electrolyte increased the resistivity of the electrode material, although it is much more conductive than organic electrolyte.
- From the CV measurements, the conductivity of the counter electrode seems to be more crucial to the performance of single electrode than the surface area of counter electrode. A Platinum counter electrode with relatively small surface area was found to improve the performance of the capacitor, likely due to its low overpotential and excellent conductivity.
- High temperature (900oC) pretreatment of activated carbon decreased the capacitance of the capacitor by 15 % and the SSA of the carbon material by around 20%, and made the CV curve more rectangular, suggesting the pretreatment step removed electrochemically active species and reduced pseudocapacitance.
- Regardless the method used, the measured capacitance was found to decrease with scan rate. The sensitivity of capacitance to change in scan rate was however different between the cyclic voltammetry (CV) and constant current charge/discharge (CD) methods. This explains the difference between these two methods in the capacitance value measured for the same capacitor. Therefore, it is recommended that any measured value of capacitance be companied by the method and scan rate used.
- There is a strong dependence of measured capacitance on internal resistance, which points to the need to correct the measured capacitance. A method based on the internal resistance measured with the CD test was proposed and applied to the capacitance values measured with the CV test. This method also can yield an instantaneous capacitance profile that is potentially useful to understanding the behaviour of EDLC and quantifying the contribution of pseudocapacitance.
- Due to the complexity involved in quantifying capacitances of EDLC, three types of capacitance, intrinsic capacitance (CI), measured capacitance (CM) and corrected capacitance (CC), were introduced and discussed. The relationship between these three defined capacitance is: CI < CC < CM.
- Measured capacitance (CM) calculated from the average current (I) from CV curve is widely accepted by researchers. However, Cc for each data point can provide more information of the capacitor performance during the whole charge/discharge process rather just “one point” value. Due to the resistance compensation, Cc is always higher than CM which is calculated from average current (I).
7. Recommendations
To study the properties of fluid coke derived activated carbon on double layer capacitance, the following investigations should be conducted in the future.
- By varying activation conditions, activated carbons with different SSA and PSD can be produced. Therefore performance such as capacitance should be tested to find out the optimal SSA and PSD for AC applied in EDLC.
- Surface functional group has been proved to be important in introducing pseudocapacitance and improve wettability, so X-ray photoelectron spectroscopy (XPS) can be used to find out what is the exact functional group such as oxygenated group or sulfur compound existing in the sample.
- By elemental analyzer, just major elements can be quantitatively tested. Impurities such as Al, Si or Vr with low concentration in the range of ppb or ppm can be detected and quantified by using a more accurate method (Inductively coupled plasma mass spectrometry) ICP-MS.
- Sulfur is normally existed in the fluid coke samples and some of the sulfur forms such as thiophene can improve the conductivity in solar cell which has been studied, so the sulfur species and the effect of them need to be further investigated in terms of improving capacitance or current leakage.
Appendix A: Calculations
A1. Calculation of Capacitance from Cyclic Voltammetry test
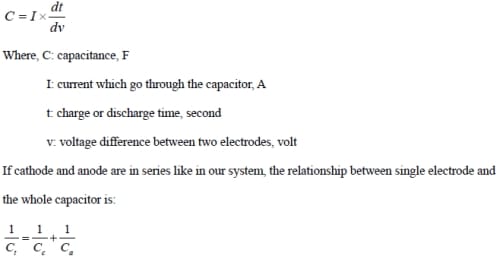
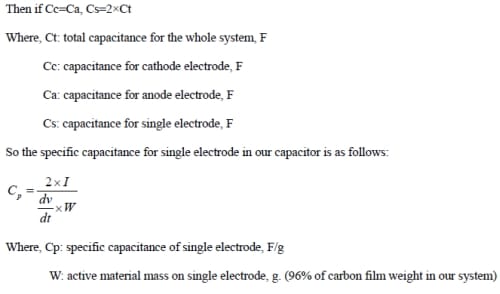
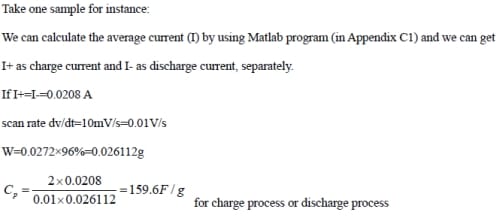
A2. Calculation of Capacitance from Charge/Discharge test
The equations and methods to be used to calculate the capacitance from charge/discharge test are in principle the same as CV.
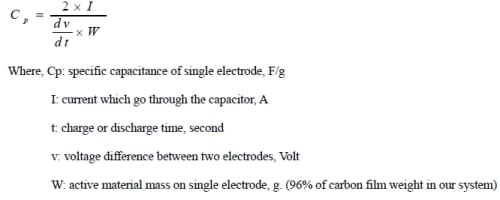
Differently, current (I) is got by calculating based on CV curves, but in CD test it is fixed as an input parameter. Meanwhile, dv/dt which is scan rate can be calculated based on the program in Appendix C2, but it is used as fixed parameter in CV test. Similarly, let’s take one sample for example: If input current I+=I-= 0.0208A
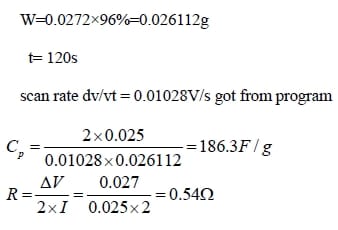
A3. Calculation of Resistance from Charge/Discharge test
The sharp voltage drop on the charge-discharge curve is mainly caused by the internal resistance in the capacitor, so we can use it to calculate R which stands for internal resistance.

Appendix B: Experimental Data
B1. Current leakage at open circuit
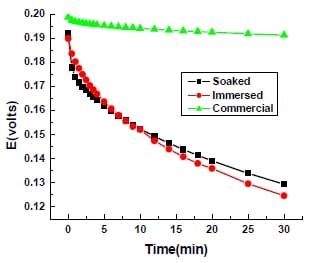
Figure B-1 Comparison of current leakage at open circuit of commercial capacitor (green line) and capacitor cell immersed in electrolyte (red line) or just soaked with electrolyte (black line).
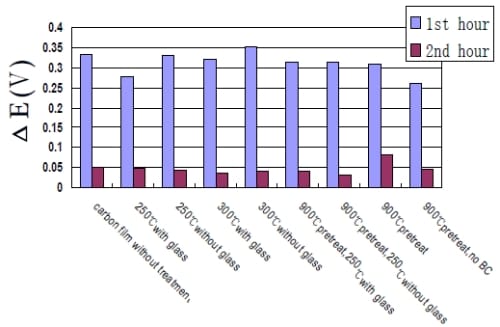
Figure B-2 Comparison of current leakage at open circuit for electrode materials pretreated at different temperatures and with glass (sintering) or not.
Rate of voltage drop can be calculated for the first hour and second hour separately. From Figure B-2, it is notable that the voltage drop in the first one hour is much quicker than the second hour and not much difference was observed between samples pre-treated at different temperatures and with sintering or not.
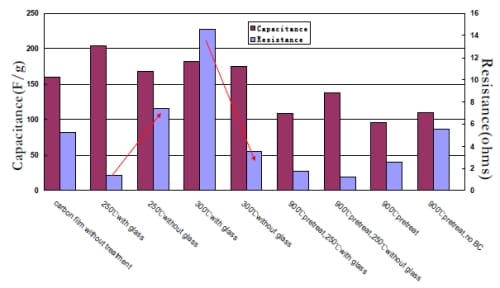
Figure B-3 Comparison of charge capacitance based on CV and internal resistance for electrode materials pretreated at different temperatures and with glass (sintering) or not.
B2. Comparison of CV or CD
results
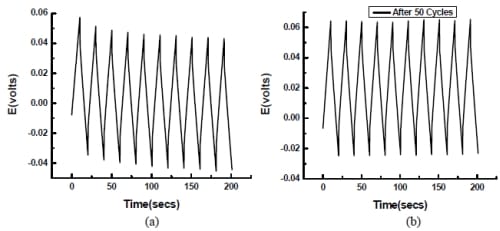
Figure B-4 Comparison of charge/discharge results on shifting problem of (a) first 10 cycles; (b) after 50 cycles.
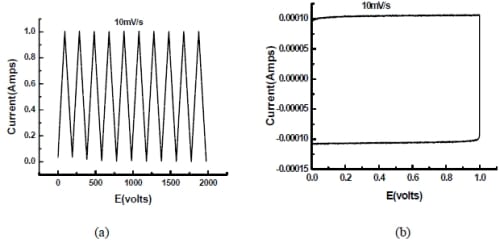
Figure B-5 Comparison of (a) cyclic voltammogram and (b) charge/discharge of 10mF commercial electrolytic capacitor.
B3. Effect of sulfur on capacitance

Figure B-6 CV curves for capacitor cell made with sulfur doped activated carbon (Sulfur=8%, SSA=1500m2/g, all mesopores) at different scan rates from 10 to 100mV/s. Sample weight=0.0207g, electrode area=3.4cm2.
Based on Figure B-6 and compared with Figure 5-25, a better performance of high rate capability was observed with the sulfur doped samples which indicated by the relatively flat CV curves even up to 100mV/s. In terms of capacitance there is not much difference.
B4. SEM Images of Activated Carbon at High Magnification
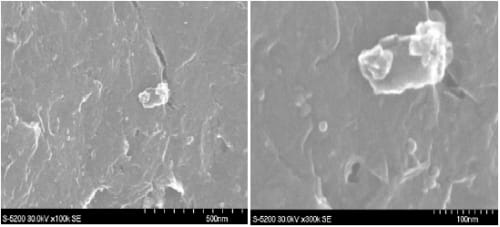
Figure B-6 SEM images of a petroleum coke derived activated carbon particle (K-PN-900C-2.5h-R2.0) at magnification of (a) 100k (b) 300k.
Appendix C: Program
C1. Matlab code of calculating current (I) from Cyclic Voltammetry
Get Data.m
clear all;
x=[ ];
y=[ ];
save sample_cv.mat
Area.m
function s = Area(x,y)
n = length(x);
s = 0;
delta = x(2) – x(1); % x is uniformly distributed and ascending, therefore the increment is the
same
fdx = y*delta;
s = sum(fdx);
AreaPositive.m
function areaPositive = AreaPositive(XI_top, fy_top_interp, XI_bottom, fy_bottom_interp)
n = length(XI_top);
s_top = 0;
delta = XI_top(2) – XI_top(1); % x is uniformly distributed and ascending, therefore the
increment is the same
fdx = fy_top_interp*delta;
fdx(find(fy_top_interp<0)) = 0;
s_top = sum(fdx);
n = length(XI_bottom);
s_bottom = 0;
delta = XI_bottom(2) – XI_bottom(1); % x is uniformly distributed and ascending, therefore the
increment is the same
fdx = fy_bottom_interp*delta;
fdx(find(fy_bottom_interp<0)) = 0;
s_bottom = sum(fdx);
areaPositive = s_top – s_bottom;
CalculateArea.m
function [s, areaPositive] = CalculateArea(x,y,isPlot)
%% Original Distribution
if( strcmp(isPlot, ‘ploton’) )
figure;plot(x,y,’-‘);title(‘Original Distribution’);
end;
%% Extract top and bottom curves ( NOTE: error may occur )
right_most_index = find(x == max(x));
fx_top = x( 1 : right_most_index );
fy_top = y( 1 : right_most_index );
fx_bottom = x( right_most_index+1 : length(x) );
fy_bottom = y( right_most_index+1 : length(x) );
if( strcmp(isPlot, ‘ploton’) )
figure;plot(fx_top, fy_top,’b-‘, fx_bottom, fy_bottom, ‘r-‘);title(‘Extract top and bottom
curves’);
end;
% Eliminate points with the same x-coordinate
[fx_top_ascend,ind] = sort(fx_top); fy_top_ascend = fy_top(ind); [fx_bottom_ascend,ind] = sort(fx_bottom); fy_bottom_ascend = fy_bottom(ind); if( strcmp(isPlot, ‘ploton’) ) figure;plot(fx_top_ascend, fy_top_ascend,’b-‘, fx_bottom_ascend, fy_bottom_ascend, ‘r-‘);title(‘Ascend’); end; ind = find(diff(fx_top_ascend) ~= 0); fx_top_distinctive = fx_top_ascend(ind); fy_top_distinctive = fy_top_ascend(ind); ind = find(diff(fx_bottom_ascend) ~= 0); fx_bottom_distinctive = fx_bottom_ascend(ind); fy_bottom_distinctive = fy_bottom_ascend(ind); if( strcmp(isPlot, ‘ploton’) ) figure;plot(fx_top_ascend, fy_top_ascend,’b-‘, fx_bottom_ascend, fy_bottom_ascend, ‘r-‘);title(‘Eliminate points with the same x-coordinate’); end; % funtion interpolation XI_top=min(fx_top_distinctive):0.00001:max(fx_top_distinctive); fy_top_interp = interp1(fx_top_distinctive, fy_top_distinctive, XI_top); XI_bottom=min(fx_bottom_distinctive):0.00001:max(fx_bottom_distinctive); fy_bottom_interp = interp1(fx_bottom_distinctive, fy_bottom_distinctive, XI_bottom); if( strcmp(isPlot, ‘ploton’) ) figure;plot(XI_top, fy_top_interp);hold;plot(XI_bottom, fy_bottom_interp,’r’);title(‘Interpolation Result’); end; % Calculate the AREA using approximated integral area_top = Area(XI_top, fy_top_interp); area_bottom = Area(XI_bottom, fy_bottom_interp); s = abs(area_top – area_bottom); areaPositive = AreaPositive(XI_top, fy_top_interp, XI_bottom, fy_bottom_interp);
TestSample.m
clear all;
figure(1);
load sample_0327_nopretreatmentI-KS-6trial3.mat
plot(x,y,’b-‘);hold on;
[area, areaPositive] = CalculateArea(x,y,’plotoff’);
result = [‘Area of sample1 curves is ‘, num2str(area)];
display(result);
result = [‘Positive Area is ‘, num2str(areaPositive)];
display(result);
C2. Program of calculating reciprocal of scan rate (dt/dv) from Charge/Discharge
// cv_slope_v01Dlg.cpp : implementation file
#include “stdafx.h”
#include “cv_slope_v01.h”
#include “cv_slope_v01Dlg.h”
#include “math.h”
#ifdef _DEBUG
#define new DEBUG_NEW
#undef THIS_FILE
static char THIS_FILE[] = __FILE__;
#endif
#define NAMEBUF 102400
/////////////////////////////////////////////////////////////////////
CAboutDlg dialog used for App About
class CAboutDlg : public CDialog
{
public:
CAboutDlg();
// Dialog Data
//{{AFX_DATA(CAboutDlg)
enum { IDD = IDD_ABOUTBOX };
//}}AFX_DATA
// ClassWizard generated virtual function overrides
//{{AFX_VIRTUAL(CAboutDlg)
protected:
virtual void DoDataExchange(CDataExchange* pDX); // DDX/DDV support
//}}AFX_VIRTUAL
// Implementation
protected:
//{{AFX_MSG(CAboutDlg)
//}}AFX_MSG
DECLARE_MESSAGE_MAP()
};
CAboutDlg::CAboutDlg() : CDialog(CAboutDlg::IDD)
{
//{{AFX_DATA_INIT(CAboutDlg)
//}}AFX_DATA_INIT
}
void CAboutDlg::DoDataExchange(CDataExchange* pDX)
{
CDialog::DoDataExchange(pDX);
//{{AFX_DATA_MAP(CAboutDlg)
//}}AFX_DATA_MAP
}
BEGIN_MESSAGE_MAP(CAboutDlg, CDialog)
//{{AFX_MSG_MAP(CAboutDlg)
// No message handlers
//}}AFX_MSG_MAP
END_MESSAGE_MAP()
/////////////////////////////////////////////////////////////////////////////
// CCv_slope_v01Dlg dialog
CCv_slope_v01Dlg::CCv_slope_v01Dlg(CWnd* pParent /*=NULL*/)
: CDialog(CCv_slope_v01Dlg::IDD, pParent)
{
//{{AFX_DATA_INIT(CCv_slope_v01Dlg)
// NOTE: the ClassWizard will add member initialization here
//}}AFX_DATA_INIT
// Note that LoadIcon does not require a subsequent DestroyIcon in Win32
m_hIcon = AfxGetApp()->LoadIcon(IDR_MAINFRAME);
}
void CCv_slope_v01Dlg::DoDataExchange(CDataExchange* pDX)
{
CDialog::DoDataExchange(pDX);
//{{AFX_DATA_MAP(CCv_slope_v01Dlg)
DDX_Control(pDX, IDC_RICHEDIT1, m_pREdit);
//}}AFX_DATA_MAP
}
BEGIN_MESSAGE_MAP(CCv_slope_v01Dlg, CDialog)
//{{AFX_MSG_MAP(CCv_slope_v01Dlg)
ON_WM_SYSCOMMAND()
ON_WM_PAINT()
ON_WM_QUERYDRAGICON()
//}}AFX_MSG_MAP
END_MESSAGE_MAP()
/////////////////////////////////////////////////////////////////////////////
// CCv_slope_v01Dlg message handlers
BOOL CCv_slope_v01Dlg::OnInitDialog()
{
CDialog::OnInitDialog();
pEdit = (CEdit*) GetDlgItem(IDC_EDIT1);
pREdit = (CRichEditCtrl*) GetDlgItem(IDC_RICHEDIT1);
CString s_edit;
s_edit.Format(“Slope is going to be here!”);
//pStatic->SetWindowText(s_temp);
pREdit->SetWindowText(s_edit);
//AfxInitRichEdit();
// Add “About…” menu item to system menu.
// IDM_ABOUTBOX must be in the system command range.
ASSERT((IDM_ABOUTBOX & 0xFFF0) == IDM_ABOUTBOX);
ASSERT(IDM_ABOUTBOX < 0xF000);
CMenu* pSysMenu = GetSystemMenu(FALSE);
if (pSysMenu != NULL)
{
CString strAboutMenu;
strAboutMenu.LoadString(IDS_ABOUTBOX);
if (!strAboutMenu.IsEmpty())
{
pSysMenu->AppendMenu(MF_SEPARATOR);
pSysMenu->AppendMenu(MF_STRING, IDM_ABOUTBOX, strAboutMenu);
}
}
// Set the icon for this dialog. The framework does this automatically
// when the application’s main window is not a dialog
SetIcon(m_hIcon, TRUE); // Set big icon
SetIcon(m_hIcon, FALSE); // Set small icon
// TODO: Add extra initialization here
return TRUE; // return TRUE unless you set the focus to a control
}
void CCv_slope_v01Dlg::OnSysCommand(UINT nID, LPARAM lParam)
{
if ((nID & 0xFFF0) == IDM_ABOUTBOX)
{
CAboutDlg dlgAbout;
dlgAbout.DoModal();
}
else
{
CDialog::OnSysCommand(nID, lParam);
}
}
// If you add a minimize button to your dialog, you will need the code below
// to draw the icon. For MFC applications using the document/view model,
// this is automatically done for you by the framework.
void CCv_slope_v01Dlg::OnPaint()
{
if (IsIconic())
{
CPaintDC dc(this); // device context for painting
SendMessage(WM_ICONERASEBKGND, (WPARAM) dc.GetSafeHdc(), 0);
// Center icon in client rectangle
int cxIcon = GetSystemMetrics(SM_CXICON);
int cyIcon = GetSystemMetrics(SM_CYICON);
CRect rect;
GetClientRect(&rect);
int x = (rect.Width() – cxIcon + 1) / 2;
int y = (rect.Height() – cyIcon + 1) / 2;
// Draw the icon
dc.DrawIcon(x, y, m_hIcon);
}
else
{
CDialog::OnPaint();
}
}
// The system calls this to obtain the cursor to display while the user drags
// the minimized window.
HCURSOR CCv_slope_v01Dlg::OnQueryDragIcon()
{
return (HCURSOR) m_hIcon;
}
void CCv_slope_v01Dlg::OnOK()
{
// TODO: Add extra validation here
CString s_edit;
s_edit.Format(“Slope is going to be here!”);
//pStatic->SetWindowText(s_temp);
pREdit->SetWindowText(s_edit);
CString c_trajectory_file_r=””;
char c_file_name[] = “*.txt”;
char c_filter[] = ” TXT File(*.txt)|*.txt||”;
CFileDialog FileDialog(TRUE, _T(“”), (LPSTR)c_file_name, OFN_LONGNAMES,
(LPSTR)c_filter);
FileDialog.m_ofn.lpstrFile = new TCHAR[NAMEBUF];
memset(FileDialog.m_ofn.lpstrFile,0,NAMEBUF);
FileDialog.m_ofn.nMaxFile = NAMEBUF;
if(FileDialog.DoModal()==IDOK)
{
c_trajectory_file_r = FileDialog.GetPathName();
// Count the number of lines in this file
FILE *pf_traj_file = fopen(c_trajectory_file_r,”r”);
char c_line[4001];
int l_LineNum = 0;
// x1: starting end of charge curves
// x2: end of charge curves
// x3: starting end of discharge curves
// x4: end of discharge curves
float x1[500], x2[500], y1[500], y2[500], slope_c[500], jump_c[500], slope_c_avg=0,
jump_c_avg=0;
float x3[500], x4[500], y3[500], y4[500], slope_d[500], jump_d[500], slope_d_avg=0,
jump_d_avg=0, jump_avg = 0;
float x_old=0, x_new, y_old=0, y_new;
while(pf_traj_file && !feof(pf_traj_file))
{
// skip the first 6 lines
for (int i=0;i<6;i++)
fgets(c_line, 4000, pf_traj_file);
// The first charge curve
// Get the first point
//for (i=0;i<10;i++) // For the 1 charge curve, the 10th point is used as the starting end of Line
// {
fscanf(pf_traj_file,”%f %f”, &x_new, &y_new);
// }
x1[0] = x_new; y1[0] = y_new;
while(!feof(pf_traj_file))
{
// The first charge curve
x_old = x_new; y_old = y_new;
fscanf(pf_traj_file,”%f %f”, &x_new, &y_new);
if( y_new < y_old )
{
// discharge curves
jump_d[l_LineNum] = fabs(y_new-y_old);
x2[l_LineNum] = x_old; y2[l_LineNum] = y_old;
//for (int i=0;i<9;i++) // For the 2nd and later charge curves, the 10th point after jump is used as the
starting end of Line
// {
//fscanf(pf_traj_file,”%f %f”, &x_new, &y_new);
// }
x3[l_LineNum] = x_new; y3[l_LineNum] = y_new;
++l_LineNum;
// Scan to the turning point
while(!feof(pf_traj_file) && y_new < y_old)
{
x_old = x_new; y_old = y_new;
fscanf(pf_traj_file,”%f %f”, &x_new, &y_new);
}// y_new > y_old
// charge curves
if(y_new > y_old)
{
jump_c[l_LineNum] = fabs(y_new-y_old);
x4[l_LineNum-1] = x_old; y4[l_LineNum-1] = y_old;
// for(int i=0;i<9;i++)
// {
// fscanf(pf_traj_file,”%f %f”, &x_new, &y_new);
// }
x1[l_LineNum] = x_new; y1[l_LineNum] = y_new;
}
if(feof(pf_traj_file))
{
x4[l_LineNum-1] = x_new; y4[l_LineNum-1] = y_new;
}
// Skip one point
//x_old = x_new; y_old = y_new;
//fscanf(pf_traj_file,”%f %f”, &x_new, &y_new);
//x1[l_LineNum] = x_new; y1[l_LineNum] = y_new;
}
}// end of file reached
}
fclose(pf_traj_file);
for(int i=0;i<l_LineNum;i++)
{
slope_c[i] = (x2[i]-x1[i])/(y2[i]-y1[i]);
slope_d[i] = (x4[i]-x3[i])/(y4[i]-y3[i]);
//jump_d[i] = fabs(y3[i]-y2[i]);
//jump_d_avg = jump_d_avg + jump_d[i];
//if(i<l_LineNum-1) { jump_c[i] = fabs(y4[i]-y1[i+1]); jump_c_avg = jump_c_avg + jump_c[i];}
//slope_c_avg = slope_c_avg + slope_c[i]/l_LineNum;
//slope_d_avg = slope_d_avg + slope_d[i]/l_LineNum;
}
//jump_avg = (jump_d_avg + jump_c_avg)/(2*l_LineNum-1);
s_temp.Format(“rn T1tT2tT3tT4”);
//s_edit.Format(“The charge factors (dt/dV) are tt%f rnThe average discharge factor
(dt/dV) is tt%f rnThe average voltage of the jump is tt%frnThere are %d cycles used in
calculation.rn”, slope_c_avg, slope_d_avg, jump_avg,l_LineNum);
s_edit += s_temp;
for (i=0;i<l_LineNum;i++)
{
s_temp.Format(_T(“rn%.2lf”), x1[i]); s_edit += s_temp;
s_temp.Format(_T(“t%.2lf”), x2[i]); s_edit += s_temp;
s_temp.Format(_T(“t%.2lf”), x3[i]); s_edit += s_temp;
s_temp.Format(_T(“t%.2lf”), x4[i]); s_edit += s_temp;
}
s_temp.Format(“nrnFactors (dt/dV) from CHARGE and DISCHARGE curves:n”);
s_edit += s_temp;
for (i=0;i<l_LineNum;i++)
{
s_temp.Format(_T(“rn%.2lf”), slope_c[i]); s_edit += s_temp;
s_temp.Format(_T(“t%.2lf”), slope_d[i]); s_edit += s_temp;
}
s_temp.Format(“nrnAbsolute voltage jump from CHARGE and DISCHARGE curves:n”);
for (i=0;i<l_LineNum;i++)
{
if(i>0) {s_temp.Format(_T(“rn%.5lf”), jump_c[i]); s_edit += s_temp;}
s_temp.Format(_T(“t%.5lf”), jump_d[i]); s_edit += s_temp;
}
//pStatic->SetWindowText(s_temp);
pREdit->SetWindowText(s_edit);
pEdit->SetWindowText(c_trajectory_file_r);
}
delete [] FileDialog.m_ofn.lpstrFile;
}
//End program
References
- Beck, F., Dolata, M., Grivei, E., and Probst, N. (2001). Electrochemical supercapacitors based on industrial carbon blacks in aqueous H2SO4. Journal of Applied Electrochemistry, 31(8), 845-853.
- Bleda-Martinez, M. J., Macia-Agullo, J. A., Lozano-Castello, D., Morallon, E., Cazorla-Amoros, D., and Linares-Solano, A. (2005). Role of surface chemistry on electric double layer capacitance of carbon materials. Carbon, 43(13), 2677-2684.
- Burke, A. (2000). Ultracapacitors: why, how, and where is the technology. Journal of Power Sources, 91(1), 37-50.
- Cai, H. (2008). Unpublished results.
- Centeno, T. A., and Stoeckli, F. (2006). On the specific double-layer capacitance of activated carbons, in relation to their structural and chemical properties. Journal of Power Sources, 154(1), 314-320.
- Chen, Y. (2002). Preparation, characterization and application of novel adsorbent from petroleum coke activated by sulfur dioxide. Thesis of M.A.Sc. University of Toronto.
- Chen, W. C., and Wen, T. C. (2003). Electrochemical and capacitive properties of polyaniline-implanted porous carbon electrode for supercapacitors. Journal of Power Sources, 117(1-2), 273-282.
- Chen, W. C., Wen, T. C., and Teng, H. S. (2003). Polyaniline-deposited porous carbon electrode for supercapacitor. Electrochimica Acta, 48(6), 641-649.
- Conway, B. E. (1999). Electrochemical supercapacitors: scientific fundamentals and technological applicatio
ns. New York: Kluwer Academic/Plenum Publishers. Coulter SA3100 Series Surface Area and Pore size Analyzer, Product Manual, version 2.11; Coulter Corp.: Miami, Florida, 1996. - Demou, E. (2003). The activation of oilsands fluid coke using sulphur dioxide as an activating agent at low temperatures. Thesis of M.A.Sc. University of Toronto. DiPanfilo, R., and Egiebor, N. O. (1996). Activated carbon production from synthetic crude coke. Fuel Processing Technology, 46(3), 157-169.
- Emmenegger, C., Mauron, P., Sudan, P., Wenger, P., Hermann, V., Gallay, R., et al. (2003). Investigation of electrochemical double-layer (ECDL) capacitors electrodes based on carbon nanotubes and activated carbon materials. Journal of Power Sources, 124(1), 321-329.
- Endo, M., Kim, Y. J., Takeda, T., Maeda, T., Hayashi, T., Koshiba, K., et al. (2001). Poly(vinylidene chloride)-based carbon as an electrode material for high power capacitors with an aqueous electrolyte. Journal of the Electrochemical Society, 148(10), A1135-A1140.
- Espinola, A., P. M. Miguel, M. R. Salles, and A. R. Pinto. 1986. Electrical properties of carbons-Resistance of powder materials. Carbon 24 (3):337-341. Evans, M. J. B., Halliop, E., and McDonald, J. A. F. (1999). The production of chemically-activated carbon. Carbon, 37(2), 269-274.
- Fang, B., Wei, Y. Z., Maruyama, K., and Kumagai, M. (2005). High capacity supercapacitors based on modified activated carbon aerogel. Journal of Applied Electrochemistry, 35(3), 229-233.
- Fink, D. G., and Beaty, H. W. (2007). Standard Handbook for Electrical Engineers. 15th ed. New York: McGraw-Hill.
- Frackowiak, E. (2007). Carbon materials for supercapacitor application. Physical Chemistry Chemical Physics, 9(15), 1774-1785.
- Fuertes, A. B., Lota, G., Centeno, T. A., and Frackowiak, E. (2005). Templated mesoporous carbons for supercapacitor application. Electrochimica Acta, 50(14), 2799-2805.
- Ganesh, V., Pitchumani, S., and Lakshminarayanan, V. (2006). New symmetric and asymmetric supercapacitors based on high surface area porous nickel and activated carbon. Journal of Power Sources, 158(2), 1523-1532.
- Gilliam, R. J., Graydon, J. W., Kirk, D. W., and Thorpe, S. J. (2007). A review of specific conductivities of potassium hydroxide solutions for various concentrations and temperatures. International Journal of Hydrogen Energy, 32(3), 359-364.
- Gryglewicz, G., Machnikowski, J., Lorenc-Grabowska, E., Lota, G., and Frackowiak, E. (2005). Effect of pore size distribution of coal-based activated carbons on double layer capacitance. Electrochimica Acta, 50(5), 1197-1206.
- Gu, H. B., Kim, J. U., Song, H. W., Park, G. C., and Park, B. K. (2000). Electrochemical properties of carbon composite electrode with polymer electrolyte for electric double-layer capacitor. Electrochimica Acta, 45(8-9), 1533-1536.
- Hahn, M., Bärtsch, M., Schnyder, B., Kötz1, R., Carlen, M., Ohler, Ch, and Evard, D. (2001). A 24 V bipolar electrochemical double layer capacitor based on activated glassy carbon. Power Sources for the New Millenium, Proceedings Volume 2000-22, The Electrochemical Society, Inc., Pennington, NJ.
- Hahn, M., Barbieri, O., Gallay, R., and Kotz, R. (2006). A dilatometric study of the voltage limitation of carbonaceous electrodes in aprotic EDLC type electrolytes by charge-induced strain. Carbon, 44(12), 2523-2533.
- Hahn, M., Wursig, A., Gallay, R., Novak, P., and Kotz, R. (2005). Gas evolution in activated carbon/propylene carbonate based double-layer capacitors. Electrochemistry Communications, 7(9), 925-930.
- Hardwick, L. J., Hahn, M., Ruch, P., Holzapfel, M., Scheifele, W., Buqa, H., et al. (2006). An in situ Raman study of the intercalation of supercapacitor-type electrolyte into microcrystalline graphite. Electrochimica Acta, 52(2), 675-680.
- Hayashi, J., Kazehaya, A., Muroyama, K., and Watkinson, A. P. (2000). Preparation of activated carbon from lignin by chemical activation. Carbon, 38(13), 1873-1878.
- Hu, Z. H., and Srinivasan, M. P. (1999). Preparation of high-surface-area activated carbons from coconut shell. Microporous and Mesoporous Materials, 27(1), 11-18.
- Janes, A., Kurig, H., and Lust, E. (2007). Characterisation of activated nanoporous carbon for supercapacitor electrode materials. Carbon, 45(6), 1226-1233.
- Kierzek, K., Frackowiak, E., Lota, G., Gryglewicz, G., and Machnikowski, J. (2004). Electrochemical capacitors based on highly porous carbons prepared by KOH activation. Electrochimica Acta, 49(4), 515-523.
- Kim, C. (2005). Electrochemical characterization of electrospun activated carbon nanofibres as an electrode in supercapacitors. Journal of Power Sources, 142(1-2), 382-388.
- Kötz, R., and Carlen, M. (2000). Principles and applications of electrochemical capacitors. Electrochimica Acta, 45(15-16), 2483-2498.
- Lanzi, O., and Landau, U. (1990). Effect of pore structure on current and potential distributions in a porous-electrode. Journal of the Electrochemical Society, 137(2), 585-593.
- Lee, S. H., and Choi, C. S. (2000). Chemical activation of high sulfur petroleum cokes by alkali metal compounds. Fuel Processing Technology, 64(1-3), 141-153.
- Li, J., Lai, Y. Q., Song, H. S., Zhang, Z. A., and Liu, Y. X. (2006). Influence of KOH activation techniques on pore structure and electrochemical property of carbon electrode materials. Journal of Central South University of Technology, 13(4), 360-366.
- Li, J., Wang, X. Y., Wang, Y., Huang, Q. H., Dai, C. L., Gamboa, S., et al. (2008). Structure and electrochemical properties of carbon aerogels synthesized at ambient temperatures as supercapacitors. Journal of Non-Crystalline Solids, 354(1), 19-24.
- Li, L., Loveday, D. C., Mudigonda, D. S. K., and Ferraris, J. P. (2002). Effect of electrolytes on performance of electrochemical capacitors based on poly[3-(3,4-difluorophenyl)thiophene]. Journal of the Electrochemical Society, 149(9), A1201-A1207.
- Li, L. X., Song, H. H., and Chen, X. H. (2006). Pore characteristics and electrochemical performance of ordered mesoporous carbons for electric double-layer capacitors. Electrochimica Acta, 51(26), 5715-5720.
- Li, W. R., Chen, D. H., Li, Z., Shi, Y. F., Wan, Y., Huang, J. J., et al. (2007). Nitrogen enriched mesoporous carbon spheres obtained by a facile method and its application for electrochemical capacitor. Electrochemistry Communications, 9(4), 569-573.
- Liu, H. Y., Wang, K. P., and Teng, H. S. (2005). A simplified preparation of mesoporous carbon and the examination of the carbon accessibility for electric double layer formation. Carbon, 43(3), 559-566.
- Lufrano, F., Staiti, P., and Minutoli, M. (2004). Influence of Nafion content in electrodes on performance of carbon supercapacitors. Journal of the Electrochemical Society, 151(1), A64-A68.
- Lust, E., G. Nurk, A. Janes, M. Arulepp, P. Nigu, P. Moller, S. Kallip, and V. Sammelselg. (2003). Electrochemical Properties of Nanoporous Carbon Electrodes in Various Nonaqueous Electrolytes. Journal of Solid State Electrochemistry, 7(2), 91-105.
- Miller, J. R., and Burke. A. F. (2008). Electrochemical capacitors: Challenges and opportunities for real-world applications. The Electrochemical Society Interface. Spring.
- Miller, J. R., and Simon, P. (2008). Fundamentals of electrochemical capacitor design and operation. The Electrochemical Society Interface. Spring.
- Mitani, S., Lee, S. I., Yoon, S. H., Korai, Y., and Mochida, I. (2004). Activation of raw pitch coke with alkali hydroxide to prepare high performance carbon for electric double layer capacitor. Journal of Power Sources, 133(2), 298-301.
- Morimoto, T., Hiratsuka, K., Sanada, Y., and Kurihara, K. (1996). Electric double-layer capacitor using organic electrolyte. Journal of Power Sources, 60(2), 239-247. Naoi, K., and Simon, P. (2008). New materials and new configurations for advanced electrochemical capacitors. The Electrochemical Society Interface, Spring.
- Niu, J
. J., Pell, W. G., and Conway, B. E. (2006). Requirements for performance characterization of C double-layer supercapacitors: Applications to a high specific-area C-cloth material. Journal of Power Sources, 156(2), 725-740. - Osaka, T., Liu, X. J., Nojima, M., and Momma, T. (1999). An electrochemical double layer capacitor using an activated carbon electrode with gel electrolyte binder. Journal of the Electrochemical Society, 146(5), 1724-1729.
- Otowa, T., Nojima, Y., and Miyazaki, T. (1997). Development of KOH activated high surface area carbon and its application to drinking water purification. Carbon, 35(9), 1315-1319.
- Pandolfo, A. G., and Hollenkamp, A. F. (2006). Carbon properties and their role in supercapacitors. Journal of Power Sources, 157(1), 11-27.
- Park, H. W., Shin, D. W., Kang, S. H., Bae, M. H., Lim, K. J., and Kim. B. H. (1997). Characteristics of electric double layer capacitor using polyvinylalcohol-lithium salts solid electrolyte. Proceedings of the 5th International Conference on Properties and Applications of Dielectric Materials. May 25-30, Seoul, Korea.
- Park, J. H., Park, O. O., Shin, K. H., Jin, C. S., and Kim, J. H. (2002). An electrochemical capacitor based on a Ni(OH)(2)/activated carbon composite electrode. Electrochemical and Solid State Letters, 5(2), H7-H10.
- Pell, W. G., and Conway, B. E. (2004). Peculiarities and requirements of asymmetric capacitor devices based on combination of capacitor and battery-type electrodes. Journal of Power Sources, 136(2), 334-345.
- Pico, F., Pecharroman, C., Anson, A., Martinez, M. T., and Rojo, J. M. (2007). Understanding carbon-carbon composites as electrodes of supercapacitors – A study by AC and DC measurements. Journal of the Electrochemical Society, 154(6), A579-A586. Qu, D. Y. (2002). Studies of the activated carbons used in double-layer supercapacitors. Journal of Power Sources, 109(2), 403-411.
- Qu, D. Y., and Shi, H. (1998). Studies of activated carbons used in double-layer capacitors. Journal of Power Sources, 74(1), 99-107.
- Ramani, M., Haran, B. S., White, R. E., Popov, B. N., & Arsov, L. (2001). Studies on activated carbon capacitor materials loaded with different amounts of ruthenium oxide. Journal of Power Sources, 93(1-2), 209-214.
- Raymundo-Pinero, E., Kierzek, K., Machnikowski, J., and Beguin, F. (2006). Relationship between the nanoporous texture of activated carbons and their capacitance properties in different electrolytes. Carbon, 44(12), 2498-2507.
- Rudge, A., Raistrick, I., Gottesfeld, S., and Ferraris, J. P. (1994).A study of the electrochemical properties of conducting polymers for application in electrochemical capacitors. Electrochimica Acta, 39(2), 273-287.
- Sivaraman, P., Hande, V. R., Mishra, V. S., Rao, C. S., and Samui, A. B. (2003). All-solid supercapacitor based on polyaniline and sulfonated poly(ether ether ketone). Journal of Power Sources, 124(1), 351-354.
- Srinivasan, V., and Weidner, J. W. (1999). Mathematical modeling of electrochemical capacitors. Journal of the Electrochemical Society, 146(5), 1650-1658.
- Sugimoto, W., Kizaki, T., Yokoshima, K., Murakami, Y., and Takasu, Y. (2004). Evaluation of the pseudocapacitance in RuO2 with a RuO2/GC thin film electrode. Electrochimica Acta, 49(2), 313-320.
- Tamai, H., Kouzu, M., Morita, M., and Yasuda, H. (2003). Highly mesoporous carbon electrodes for electric double-layer capacitors. Electrochemical and Solid State Letters, 6(10), A214-A217.
- Wada, H., Nohara, S., Furukawa, N., Inoue, H., Sugoh, N., Iwasaki, H., et al. (2004). Electrochemical characteristics of electric double layer capacitor using sulfonated polypropylene separator impregnated with polymer hydrogel electrolyte. Electrochimica Acta, 49(27), 4871-4875.
- Wang, K. P., and Teng, H. S. (2006). The performance of electric double layer capacitors using particulate porous carbons derived from PAN fiber and phenol-formaldehyde resin. Carbon, 44(15), 3218-3225.
- Wang, X. F., Ruan, D. B., Wang, D. Z., and Liang, J. (2005). Hybrid electrochemical supercapacitors based on polyaniline and activated carbon electrodes. Acta Physico-Chimica Sinica, 21(3), 261-266.
- Wei, Y. Z., Fang, B., Iwasa, S., and Kumagai, M. (2005). A novel electrode material for electric double-layer capacitors. Journal of Power Sources, 141(2), 386-391.
- Weng, T. C., and Teng, H. S. (2001). Characterization of high porosity carbon electrodes derived from mesophase pitch for electric double-layer capacitors. Journal of the Electrochemical Society, 148(4), A368-A373.
- Xing, W., Qiao, S. Z., Ding, R. G., Li, F., Lu, G. Q., Yan, Z. F., et al. (2006). Superior electric double layer capacitors using ordered mesoporous carbons. Carbon, 44(2), 216-224.
- Xu, B., Wu, F., Chen, R. J., Cao, G. P., Chen, S., Wang, G. Q., et al. (2006). Room temperature molten salt as electrolyte for carbon nanotube-based electric double layer capacitors. Journal of Power Sources, 158(1), 773-778.
- Yang, C. C., Hsu, S. T., and Chien, W. C. (2005). All solid-state electric double-layer capacitors based on alkaline polyvinyl alcohol polymer electrolytes. Journal of Power Sources, 152(1), 303-310.
- Zhang, B., Liang, J., Xu, C. L., Wei, B. Q., Ruan, D. B., and Wu, D. H. (2001). Electric double-layer capacitors using carbon nanotube electrodes and organic electrolyte. Materials Letters, 51(6), 539-542.
- Zhang, J. R., Jiang, D. C., Chen, B., Zhu, J. J., Jiang, L. P., and Fang, H. Q. (2001). Preparation and electrochemistry of hydrous ruthenium oxide/active carbon electrode materials for supercapacitor. Journal of the Electrochemical Society, 148(12), A1362-A1367.
- Zheng, J. P. (2004). Resistance distribution in electrochemical capacitors with a bipolar structure. Journal of Power Sources, 137(1), 158-162.
- Zhang, L., Liu, H. B., Wang, M., & Liu, W. (2006). Carbon aerogels for electric double-layer capacitors. Rare Metals, 25, 51-57.
- Zuleta, M., Bjornbom, P., and Lundblad, A. (2005). Effects of pore surface oxidation on electrochemical and mass-transport properties of nanoporous carbon. Journal of the Electrochemical Society, 152(2), A270-A276.
- Zuleta, M., Bjornbom, P., and Lundblad, A. (2006). Characterization of the electrochemical and ion-transport properties of a nanoporous carbon at negative polarization by the single-particle method. Journal of the Electrochemical Society, 153(1), A48-A57.
- Zuleta, M., Bjornbom, P., Lundblad, A., Nurk, G., Kasuk, H., and Lust, E. (2006). Determination of diffusion coefficients of BF4- inside carbon nanopores using the single particle microelectrode technique. Journal of Electroanalytical Chemistry, 586(2), 247-259.
- Zuleta, M., Bursell, M., Bjornbom, P., and Lundblad, A. (2003). Determination of the effective diffusion coefficient of nanoporous carbon by means of a single particle microelectrode technique. Journal of Electroanalytical Chemistry, 549, 101-108.


