a Department of Biomedical Engineering, New Jersey Institute of Technology, Fenster Hall, University Heights, Newark, NJ 07102-1982, United States b Kessler Medical Rehabilitation Research and Education Corporation, 1199 Pleasant Valley Way, West Orange, NJ 07052, United States c Sensory Motor Performance Program, Rehabilitation Institute of Chicago, 345 East Superior Street, RIC 1365, Chicago, IL 60611, United States d Department of Biomedical Engineering, Illinois Institute of Technology, Chicago, IL, United States
Abstract
A wearable finger flexion monitor developed to measure hand function in individuals with hand dysfunction was evaluated for feasibility, measurement repeatability and reliability, fidelity of wireless transmission, and user acceptance. Configuration of the monitor allows use in situations when a traditional measurement glove cannot be worn. Five healthy individuals participated in the study of repeatability, while 10 healthy individuals and 10 individuals with acquired brain injury participated in trials to assess feasibility and user comfort. Repeatability results showed an overall error of 3.4°, compared to 5.5° and 5.7° reported with other sensor gloves, and to manual measurements (5–8°). Intraclass coefficient of reliability (using coefficient alpha) averaged 0.95. User feedback regarding comfort of the monitor was very high. Loss of data during wireless transmission was no greater than 1.2%. Results demonstrate that the monitor has a strong potential to be used as a tool for objective hand function evaluation in the home and community for both short- and long-term monitoring.
Keywords: Electro goniometry; Finger flexion; Hand function; Functional outcome measures; Wireless monitoring
1. Introduction
Rehabilitation researchers would like to quantify finger posture in order to understand joint motion during activities of daily living in individuals with movement disorders. Knowledge of how individuals use their hands and fingers as they interact with their home and community environments is critical in effectively planning and evaluating rehabilitation therapy and treatments for upper limb movement disorders. Evaluation of function directly in these environments would provide more realistic information than data collected in the clinic. For example, collection of hand posture data while individuals perform everyday activities such as eating, dressing, and manipulating objects would provide a much clearer picture of true hand usage, which may differ from the functional potential that is traditionally assessed in a clinical setting with ordinal scales such as the Functional Independence Measure or Modified Ashworth Scale (Bohannon and Smith, 1987).
While precise measurements of various aspects of finger motor control can be made in the laboratory (Darling et al., 1994; Lang and Schieber, 2004; Li et al., 2003), it is not clear how well these measurements correspond with utility in everyday life. The ability to monitor hand usage for extended periods of time in more natural environments could yield valuable information about the efficacy of various interventions.
Assessment of hand function typically encompassess several measurements such as range of motion (ROM), strength and ability to perform functional tasks. Evaluation of ROM has traditionally been a manual test in which flexion and extension are measured one joint at a time using a goniometer. While this provides useful information on passive ROM, it is impossible to evaluate ROM during the performance of functional tasks without special devices. Active ROM and functional ROM have been proposed as functional measures for a variety of evaluations including metacarpophalangeal (MCP) joint motion following joint replacement, prosthesis performance (Fowler and Nicol, 2001; Hume et al., 1990; Mallon et al., 1991) and surgical efficacy. However, it has not been established which method is the most appropriate to measure ROM to assess functional capacity (Hume et al., 1990; Mallon et al., 1991).
Beyond simple range of motion, detailed information about specific hand movements can be used to augment traditional methods in assessing function for rehabilitation, workplace overuse and usability issues, and compliance with physical therapy or telerehabilitation (Dipietro et al., 2003). In many of these cases, long-term monitoring of hand use has been proposed (Fowler and Nicol, 2001). However, no guidelines exist for minimum sampling rates, signal resolution and accuracy values, or sensor configurations appropriate for home use to provide useful information at a reasonable price.
Gloves containing sensors to measure flexion and extension have been proposed for semi-automated goniometery in order to address the shortcomings of passive measures and to explore functional activities (Dipietro et al., 2003; Rand and Nicol, 1993; Williams et al., 2000). Instrumented gloves or individual sensors can measure dynamic values of hand and finger posture in real time and store these data for post-processing and analysis. For example, commercial gloves include the Data- Glove family (Fifth Dimension Technologies (5DT), Irvine, CA), Cyberglove (Immersion Corporation, San Jose, CA), and the HumangloveTM (Humanware S.R.L., Pisa, Italy). Various non-commercial devices have also been reported (Rand and Nicol, 1993; Karlsson et al., 1998; Zurbrugg, 2003; Jurgens and Patterson, 1997; Hofmann and Henz, 1995; Asada and Mascaro, 1999; Williams et al., 2000). Traditionally, these gloves have been directly cabled to a data collection computer and have restricted the wearer’s movements. However, some companies now offer a wireless connection between the glove and a nearby data collection computer, allowing the wearer to move freely within the room. Both 5DT and Immersion have released wireless versions of their gloves, which use Bluetooth® technology to transmit data to nearby computers. These wireless options can be expensive and do not give the wearer freedom to move about the home and commuity settings while data is being collected.
A second drawback of existing instrumented gloves is that most may be difficult or impossible to don by individuals with significantly reduced range of motion in the hand and fingers secondary to brain injury or other trauma, as the glove must fit snugly enough to keep the sensors properly located over the joint of interest. In studies with quadriplegia, Castro and Cliquet found that gloves used to measure object manipulation had to be customized for each individual to ensure optimal sensor position and glove sizing (Castro and Cliquet, 1997). BothWise and Dipietro found the commercial gloves used in their repeatability analyses fit poorly on healthy female subjects due to smaller hand size (Di
pietro et al., 2003; Wise et al., 1990). Research studies reporting the use of commercial measurement gloves in the brain injured population report that individuals tested had relatively high levels of hand function and were physically able to don the glove. In the two studies reporting use of the Cyberglove with individuals with brain injury, all individuals had sufficient passive ROM to don the glove (> 65° finger and 43° thumb ROM) (Merians et al., 2002) or functional capacity to hold a pen with precision grip (Lang and Schieber, 2003). Details on other devices and their applicability to this application appear elsewhere (Simone and Kamper, 2005).
Existing measurement methods (i.e., gloves) are not the optimal solution for assessing functional capacity over time and in the community for the broad range of hand function disorders observed in the clinic or rehabilitation facility. The Shadow Monitor was developed to allow unobtrusive measurements of finger postures across all ability levels in this underserved population (Simone and Kamper, 2005). Rather than encase the hand and fingers entirely and thereby exclude some individuals who cannot wear a glove-like device, it was designed to be worn on the back of the hand and shadow the wearer’s hand activities. The device wirelessly records continuous streams of finger posture as individuals perform daily activities, providing a wealth of new information for the evaluation and treatment of movement disorders in the hand and fingers. Short- or long-term testing can be performed without tethering to a computer. Data can be stored locally on the device if transmission to a computer is not possible. Currently up to eight sensors can be used; while attachment anywhere on the hand is possible, we attached sensors to the dorsum, leaving the palm free of obstruction. The system is significantly less expensive than currently available wireless systems.
The purpose of this research was to evaluate the device for use in clinical populations. Repeatability and reliability of sensor measurements, wireless transmission rate failure, and user acceptability were assessed.
2. Methods
2.1. The Shadow Monitor
2.1.1. Components
The Shadow Monitor is a lightweight measurement device designed to measure finger joint flexion automatically. The wearable system includes a signal conditioning/wireless transmitter box and a disposable sensor glove containing commercially available sensors. The electronics box can be mounted at different places on the arm based on activity and comfort of the subject. Mounting on either the forearm (Fig. 1) or upper arm is possible (Fig. 2a).
The most important requirements for the Shadow Monitor, unlike the priorities for most commercial systems, are ease and comfort of donning and removal for individuals who have significantly reduced range of motion in the hand and fingers.
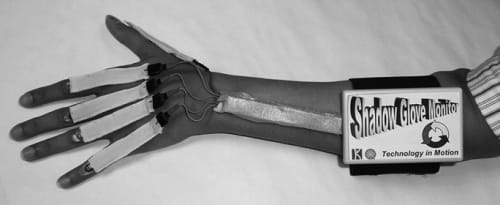
Fig. 1. The Shadow Monitor.
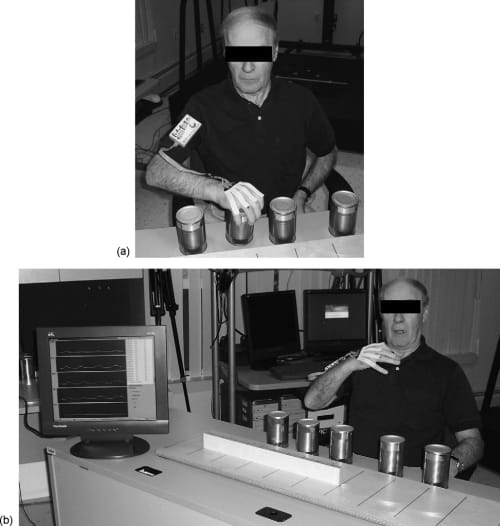
Fig. 2. The ShadowMonitor wireless data transmission demonstration. (a) The subject performs a functional task while data is wirelessly transmitted. (b) The subject alternately opens and closes his hand while data is transmitted to a computer behind the display. The flexion–extension curves for each MCP joint are shown on the display in real time.
Additional requirements include low cost and lightweight construction, unencumbered movement around the home and in the community during data collection, and unobstructed sense of touch on the palmar side of the hand.
Thus, the configuration of this device is significantly different from existing measurement gloves in that fingers are not encased in individual pockets of material. The glove is composed of individual Lycra® sleeves for each joint to be monitored. Each sleeve contains a bend sensor encased in a thin plastic sheath. The sensor, plastic sheath, and outer sleeve are secured together at the proximal end of the assembly. The outer sleeve is attached to the dorsal aspect of the finger using double sided medical grade adhesive tape (MACTac, Stow, OH). The tape is applied on the skin proximal and distal to the joint such that the joint is free to move. The inner plastic sleeve facilitates easy movement of the sensor within the Lycra® sleeve as the finger joint is moved.
In its current configuration, the “glove” supports up to eight sensors; the analysis presented here focused on the five MCP joints. In order to address cost and durability concerns, inexpensive bend sensors, manufactured by Flexpoint Sensors (Draper, UT), are used. These sensors change resistance when bent. A common characteristic of bend sensors is a time-varying creep when held in a fixed, bent position, and sometimes inaccuracy returning to the same baseline (flat) resistance value. These can introduce significant error over time. Flexpoint sensors were selected after we evaluated several sensor configurations from different manufacturers. Decay in sensor value after a pseudostep increase in bend angle was 0.6% full scale or 6.1% of the step amplitude after 15 s, as compared to 9.5 and 24.4% for the next best and popular Abrams-Gentile sensor (Abrams-Gentile Entertainment Inc., New York, NY). While not insignificant, these errors are an acceptable tradeoff between accuracy and durability/cost. The behavior of these sensors and testing protocols is explored in more detail elsewhere (Simone and Kamper, 2005).
The arm-mounted box of the current system contains signal conditioning electronics, a microprocessor, nonvolatile memory storage, and the wireless transmitter/receiver (see the block diagram in Fig. 3). Signals are level shifted to a range of 0–1.5V in preparation for analog-to-digital (A/D) conversion. The remaining functionality is implemented with a TmoteSky device (MoteIV Corporation, Berkeley, CA). Each “mote” contains 10 k RAM, 48 k FLASH, external 1MB FLASH (for data storage), 8 12-bit A/D channels, 250 kbps 2.4 GHz IEEE 802.15.4 Chipcon Wireless Transceiver, and an onboard antenna. Operations are controlled by a Texas Instruments MSP430 microcontroller.

Fig. 3. Block diagram of Shadow Monitor.
Finger flexion signals are sampled using the 12-bit A/D and stored in onboard FLASH memory. The entire system (including mote, sensors, and signal conditioning hardware) is powered by 2 AA batteries, which are sufficient to complete a minimum of 24 h of data collection. The wearable portion of the system weighs approximately 145 g (five sensors + sleeves: ~5 g, signal conditioning box: 85 g, two AA batteries: 55 g). Two separate motes are used in the system: the first is a “sampling” mote that resides inside the arm-mounted box; the second is a “base station” mote that is inserted into the USB port of a computer or laptop to receive the data transmitted from the wearable device.
The wireless protocol selected for the Shadow Monitor is the IEEE Standard for Low-Rate Wireless Personal Area Networks (IEEE 802.15.4) (2003). This newer standard was specifically proposed by the measurement community to fill a need for extremely lower power, lower data transmissions for sensor net monitoring, home health monitoring and telemedicine, and home automation (Adams, 2004). ZigBee is the primary protocol based on this IEEE standard. The standard is a lower data rate sibling of Bluetooth® and uses the existing 4 GHz Industrial, Scientific and Medical (ISM) band which the FCC set aside for applications such as medi
cal telemetry. It has also been proposed in the implementation of a wireless body area network (WBAN) for rehabilitation applications and ambulatory monitoring (Jovanov et al., 2005). New products based on this standard are being proposed, starting with remote monitoring for home networks that include appliance control, security, remote utility meter reading, and anti-fire systems.
2.1.2. Modes of operation
The Shadow Monitor can operate in three data collection modes; the appropriate mode is automatically selected and controlled by the arm unit software. These are: (1) the Sample-and- Send mode, in which the arm unit collects data and transmits all data immediately to a data collection computer using the wireless link (no data is stored locally on the arm unit); (2) the Sample-and-Save Mode, in which data is collected and stored locally on the arm unit (no external computer is required); (3) the Sample-and-Dump Mode, in which new data is sampled and immediately transmitted, and any data stored in local memory is simultaneously sent until all stored data is cleared from memory. Modes 2 and 3 use 1MB of onboard memory to store data; the amount of time the monitor can store data without sending it to an external computer depends on the number of sensors used, the desired sampling rate, and use of a data compression algorithm. Data acquired after 1MB has been stored will be lost if no receiving computer is available. All modes use the same sampling rate, although the effective over-the-air transmission rate may be higher depending on which data collection mode is used. Our experimental protocols may use different sampling rates depending on the desired outcomes.
Raw data sampling was initially performed at 25 Hz, with later testing verifying low error rates at sampling frequencies up to 75 Hz. Power spectral density of finger movements has been studied between 1 and 32 Hz (Van Galen et al., 1990) and fastest reported hand motions (including hand writing) are around 5–6 Hz (Durlach and Mavor, 1994). While common motion analysis systems often sample at higher rates (e.g., 60 or 120 Hz), the data are generally low-pass filtered with a significantly lower cutoff frequency for subsequent analysis. In a study of hand synergies during reach-to-grasp, data were filtered to 6Hz (Mason et al., 2001), and for sensory motor hand training in stroke subjects, a 12Hz cutoff was used (Merians et al., 2006). The Nyquist criterion would suggest that the corresponding sampling rate would be twice that, at approximately 25 Hz, in line with our lower sampling rate.
Selection of operational mode is controlled by the sampling mote located in the arm unit. The sampling mote initially searches for a path to the base station mote, which is connected to the USB port on a personal computer or laptop. If the base station is detected, the device establishes communications with the base station mote and uses Sample-and-Send mode to begin sending data (Mode 1). Data are transmitted in a 28-byte data payload per packet. A time stamp is included for each set of samples. Handshaking between the sampling mote and the base station mote is controlled by the Media Access Control layer as specified by the IEEE 802.15.4 standard. If no data path is detected between the arm unit and the base station mote, the ShadowMonitor enters Send-and-Save mode (Mode 2). All sampled data are stored locally in the arm unit FLASH memory. In this mode, 50 min of raw, uncompressed data sampled at 25 Hz can be stored, which is appropriate for our shorter evaluation and measurement sessions. For extended data collection sessions in the home and community, data can be compressed or preprocessed to allow for additional data to be collected before data loss occurs. Simple bit compression allows storage of 90 min of continuously sampled raw data, while preprocessing the raw data can extend the out-of-range time to over 3 h. Participants in 24 h trials receive instructions to spend no more than 3 h away from home (or the location of the receiving computer) in order to prevent data loss.
While in the Send-and-Save mode, the arm unit periodically checks for the presence of a base station mote every 1000 ms (1 s). Should the path to the base station become available, communications are established (or re-established) and the system enters the Sample-and-Dump mode (Mode 3). (This base station detection behavior occurs in all modes to reestablish a connection if none has been detected, or to ensure that any current connection is still present.) In this combination mode, new data are still sampled and sent over the air at the original sampling rate. Interspersed between these packets of new data, the arm unit begins sending additional data packets containing the previous data that had been saved to local memory. The system continues in this combination mode until the local memory is empty.
Software for the arm unit sampling mote and the base station mote is written in NesC (an extension to the C language) and runs on the open source TinyOS operating system designed for wireless embedded sensor networks (U.C. Berkeley). The base station transfers the data to the computer using a Java program that controls communication between the base station mote and the computer. Data are stored in an ASCII data file and later converted into joint angles based on previously recorded calibration data. The time stamp can be used to sort the data on the computer. This is necessary if the arm unit has ever stored data locally, because when communications are reestablished, new and saved data packets are sent intermixed until the memory is empty. To assist in data collection, the raw data can also be displayed on the computer screen using a custom Java oscilloscope program (shown in Fig. 2b), allowing the tester to ensure that the sensors are properly placed, that the electronics are functional, and that the wireless link is operational.
2.2. Experimental procedures
2.2.1. Subjects
Five healthy individuals with no movement disorders in the hands participated in the repeatability and reliability studies presented here. Three women and two men, aged 22–47 years, performed the tasks. All subjects were right handed and the glove was placed on the dominant right hand by the investigator.
Feedback on comfort and usability of the glove was obtained from this group and from a further group of 15 participants: 10 with acquired brain injury (ABI) and an additional 5 healthy controls (HC). Demographics of the entire group included 10 men and 10 women. In the ABI population, the average age was 59±11 years (40% female). The glovewas always placed on the impaired hand. All individuals were right handed, and 4 of 10 subjects wore the glove on the non-dominant hand. Individuals in the ABI population had been diagnosed with stroke on average 4.8 years prior to testing. In order to investigate the performance and comfort of the glove under use, inclusion criteria included sufficient volitional hand function to hold a pen and pick up small objects like a checker, with no time restriction.
In the healthy population, the average age was 41±19 years (60% female). Nine out of 10 individuals were right handed. Because some individuals with ABI were tested using the nondominant hand, 2 of the 10 healthy subjects also wore the glove on the non-dominant hand.
All testing was performed at Kessler Medical Rehabilitation Research and Education Corporation (KMRREC),West Orange, NJ. At the initiation of the testing session, all participants completed an Institutional Review Board (IRB) consent form and HIPAA authorization form approved by the KMRREC IRB.
2.2.2. Calibration
Calibration was performed for each individual (ABI and HC) and each sensor after all sensors were applied and prior to data collection. The evaluator passively moved each joint through t
he full range of motion using a manual goniometer as flexion data were automatically captured by the computer. The evaluator paused for several seconds at specific joint angles including maximum extension (hyperextension), 0°, 30°, 60°, 90°, and maximum flexion. At each angle, a second evaluator pressed a pushbutton to place a marker in the data file for subsequent data analysis. Rawvoltage values corresponding to these goniometric values were captured automatically. The measurement process took approximately 8 min per person.
2.2.3. Repeatability testing and reliability analysis
Repeatability was performed using the methods proposed by Wise and expanded by Dipietro for the evaluation of semi- or fully-automated goniometric gloves (Dipietro et al., 2003;Wise et al., 1990). Wise proposed four tests for repeatability of measurement. Two tests use a gripped hand position and two use a flat hand position. Permutations of these two hand positions are used to test repeatability with the glove kept on between measurements, and with the glove removed and then replaced between measurements. We divided this testing into two parts, focusing initially on the repeatability of measurement in both grip and flat hand positions, with the glove on between measurements (Tests A and C). These two tests best mirror our initial goals to assess the usefulness of this new system for short term and 24 h monitoring, and to compare how individuals with and without brain injury performed different activities. Repeated donning testing will be performed separately before any proposed preand post-evaluations are initiated.
A prototype version of the arm-mounted system was used. To separate sensor errors from those attributable to wireless transmission, the raw sensor signals were captured directly using an 8 channel 16-bit A/D card sampled at 25 Hz using LabView (National Instruments, Austin, TX).
Test A: A roughly cylindrical custom plaster mold was created for each subject to ensure that the fingers were flexed to the same position for each repetition of the test for a given subject (see Fig. 4). The participant clenched the mold for 6 s and then released the mold for 6 s. This clench/release cycle was repeated 10 times. Repeatability measurements were taken from each sensor during the clench phase. During data collection, an operator manually depressed a pushbutton to place an electronic marker in the data file indicating each stable clench phase after hand and finger movement stopped. The digital pushbutton signal was sampled simultaneously with the sensor signals and stored together with those data.
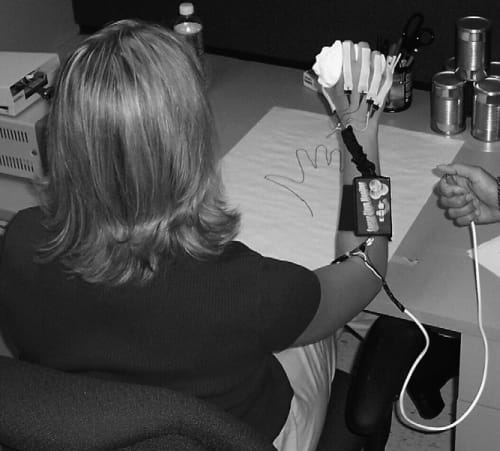
Fig. 4. Subject participating in repeatability testing.
Test C: The participant placed the hand on a table top and alternately raised the hand and lightly flexed the fingers, and then returned the hand to the table top, for 6 s at each position. Repeatability of the flat hand position was explored in this test. In order to achieve repeatability in hand and finger position, an outline of the hand profile was drawn on paper and placed on the table. This cycle was also repeated 10 times. During data collection, an operator manually depressed a pushbutton to place an electronic marker in the data file indicating each flat hand phase.
For each test above, the participant rested for at least 1 min, and then repeated the entire test. Thiswas done 10 times for both Test A and C, for a total of 100 grip/release cycles for each test.
2.2.4. Wireless communication systems testing
Reliability of the wireless link was tested under three conditions and the error in each condition was computed. For all tests, data were recorded from five channels and continuously sampled at 25 Hz. In the first test condition, the sampling mote was always within range of the base station mote, so all data were immediately transmitted after each sample was collected (Sample-and-Send, Mode 1). Data from all five channels, with timestamp, were transmitted together in each packet. The sampling and transmitting was performed for 30 min.
In the second test condition, the sampling unit was kept out of range of the base station during the 30-min sampling period. All data were saved locally on the FLASH memory of the sampling unit (Sample-and-Save, Mode 2). After the completion of sampling, the unit was brought within range of the base station and the entire block of saved data was transmitted at 25 Hz.
In the final test condition, the sampling unit was removed from the vicinity to purposely prevent transmissions to the base station mote for the first 15 min of the sampling period. The sampling unit was then brought into range of the base station to allow the monitor to begin sending stored data as well as newly collected data (Sample-and-Dump, Mode 3). The monitor automatically initiated concurrent transmission of new sampled data (at 25 Hz) with transmission of the stored samples (at 15 Hz) until all of the stored samples were sent. The effective over-theair transmission rate for this test was 40Hz (25 Hz + 15 Hz).
2.2.5. Battery life testing
Testingwas performed to determine battery life of the device. Two fresh AA alkaline batteries were inserted in the arm unit, and both the arm unit and the base station receiving laptop were started. The system was placed in Mode 1, Sample-and Send. Data were received continuously by the base station mote and stored to the computer’s hard drive. Proper sensor sampling and wireless data transmission was verified periodically over the testing period using the graphical oscilloscope program.
2.2.6. User feedback questionnaire
We administered a short questionnaire at the completion of the protocol after the monitor was removed. This questionnaire was designed to elicit feedback on the participant’s experience with the monitor and includes questions on comfort during donning, use, and removal. One question, in addition to open-ended discussion following completion of the questionnaire, focused on the participant’s feedback on wearing this device in public. Each participant was asked what changes, if any, could be made so that wearers would not alter their normal hand-use behaviors while wearing the monitor outside of the clinic. The 11-item questionnaire appears in Table 1.
For each item, participants were asked to select one of seven statements to indicate how strongly they agree or disagree with each item (strongly disagree, disagree, somewhat disagree, neutral, somewhat agree, agree, strongly agree).
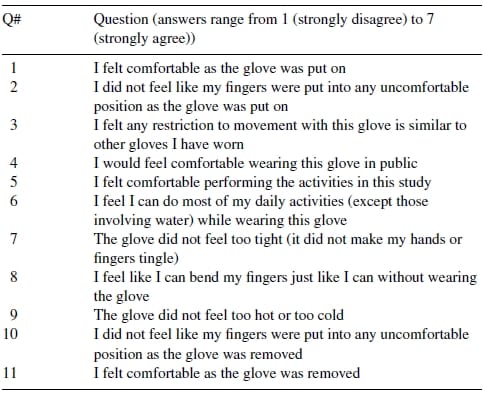
Table 1 – User feedback questionnaire
2.3. Analysis
2.3.1. Calibration
Data files containing the goniometric data collected during passive joint manipulations over the entire range of motion were evaluated to extract the raw voltage value that corresponded to each joint angle. The files were manually scanned to locate the pushbutton markers for maximum extension (hyperextension), 0°, 30°, 60°, 90?°, and maximum flexion. Using the pushbutton signal as a marker; approximately 1 s of data immediately preceding the pushbutton was averaged to arrive at the corresponding voltage value. Depending on the values of maximum flexion for each joint, 3–5 voltage–angle pairs were identified for each sensor/joint over the passive range of motion for that joint.
The voltage–angle relationship is not linear, so from these pairs the MATLAB (The Mathworks, Inc.) shape-preserving interpolation function, pchip, was used to generate a look-up table of interpolated voltage–angle values at 0.1? intervals, such that the resulting lookup tables could be used to c
onvert raw sensor voltage to calibrated angle for all raw datafiles. Pchip is a piecewise cubic interpolation method that uses the same breakpoints as piecewise linear interpolation, while removing the instantaneous change in slope at each breakpoint (voltage–angle pair) to smooth the curve (Moler, 2004). A sample interpolated curve with several voltage–angle pairs is shown in Fig. 5. A custom C-language program was written to read the lookup tables for each joint, and then convert all raw data files into new files containing calibration joint angles. All subsequent data analysis was performed on the converted files.
2.3.2. Repeatability testing
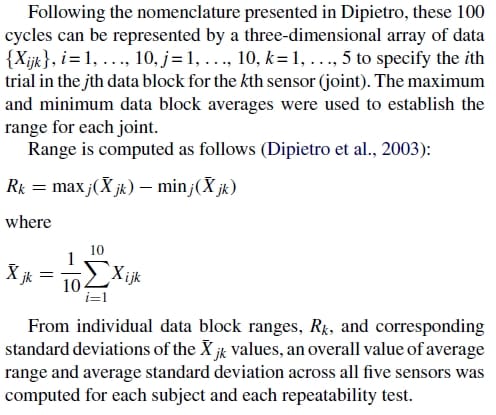
Data processing for the repeatability testing was performed semi-automatically using a custom Excel spreadsheet template. Each raw data file contained one data block of 11 grip (or flat hand) actions; the first trial was a practice action that is not included in the analysis. For each of the 10 trials in the data block file, the spreadsheet automatically located the pushbutton spikes corresponding to these actions, and computed an average value for each joint sensor over a three second window just prior to the pushbutton time. This process produced 10 trial values for each joint (variable i), which are averaged to produce a single value for each joint (variable k) for the data block (variable j). This process was repeated for each of the 10 data blocks of data collected, to produce an average flexion value for each joint for each data block.
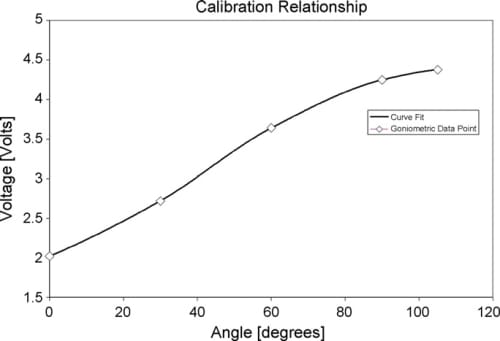
Fig. 5. Sample voltage-to-angle relationship using shape-preserving linear interpolation.
2.3.3. Reliability analysis
Reliability analysis was performed by computing an Intraclass coefficient (ICC) to identify the source of variability between measures. ICC values close to 1 indicate high internal consistency in the measurement method, giving confidence that the test results reflect true scores. To evaluate the ICC, methods introduced in Dipietro et al. (2003) were repeated here. Reliability analysis for Test A and Test C was performed by randomly selecting 2 of the 10 data blocks per subject, and further randomly selecting 1 of the 10 trials within each data block. ICC was computed for each digit. This was repeated 20 times. Mean and standard deviation of the individual ICC values was computed for each digit and for each test as a whole.
2.3.4. Wireless communication systems testing
The transmission error rate was computed for each of the three test conditions described above. Using the transmitted time stamp, the time interval between successive data packets was computed and saved to the computer. (In this implementation, one data packet is equal to one sample of data from all five MCP joints plus the corresponding timestamp.) From this interval, and knowledge of the sampling rate, the total number of missing packets was computed for each mode. This number was divided by the total number of packets to compute the transmission error rate. Additionally, the largest number of consecutive samples lost could also be determined from this information. It should be noted that the software currently has no error correction algorithms implemented. Samples not saved to the computer represent those either not received as determined via frame acknowledgement, or those received with errors as determined by data verification functionality provided by the Medium Access Control (MAC) layer of the IEEE standard.
2.3.5. Battery life testing
After a period of nonstop operation, battery capacity decreases until a point is reached when the sampling mote can no longer transmit data reliably to the base station mote. The battery life of the device was defined as the total elapsed time until the base station mote could no longer detect the sampling mote to receive data packets.
2.3.6. User feedback questionnaire
Participant responses to the individual questions were converted into numerical values ranging from 1 to 7 with 7 corresponding to “strongly agree.” The scale generates an overall score of 11–77 where higher scores indicate more favorable feedback. A mean score for each of the 11 questions was computed across subjects.
3. Results
3.1. Repeatability testing
Following calibration, raw data block files were processed. A single data block file contains 10 cycles for each of the 5 MCP joints; a sample data block from Test C (flat hand) is shown in Fig. 6. In Fig. 7, a sample data block for one joint from Test A (grip mold) is shown with pushbutton markers that are used to automatically extract joint angles for each position. Ten such data block files were processed to produce 10 averaged values for each joint, as shown in Fig. 8. The decay present before each pushbutton signal is attributable to two factors: relaxation as users gripped the mold (most significant contribution discussed below), and the creep in sensor value caused by the mechanical sensor properties mentioned previously.We observed Dipietro’s findings that changes in grip force affected measured values; even small changes in joint position caused by increased muscle contraction were captured by the sensors. To compensate, we followed Dipietro’s recommendations that subjects be asked to grip the mold with as low of a force as possible. Subjects were instructed to grasp the mold and then relax their fingers just enough to make good contact with the mold, without squeezing it. During data collection, we watched each subject and the real-time data until movements stopped and the self-paced adjustment period ended.
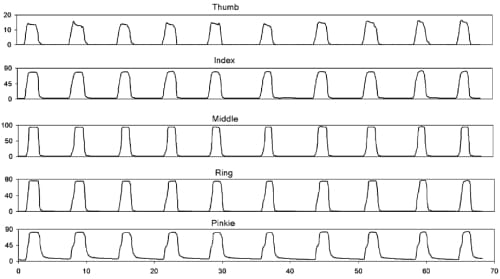
Fig. 6. Raw grip-release data from each joint (top: thumb, bottom: pinkie) for a single data block collected during the performance of Test C (flat hand). Angles are in degrees.
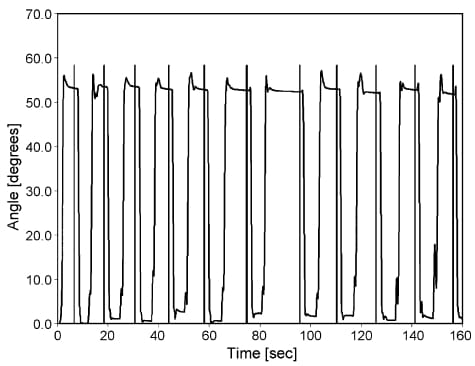
Fig. 7. Repeatability flexion data from one joint during the performance of Test A (grip mold). Data segmentation is performed by automatically averaging several seconds of data before each manual pushbutton (shown as vertical lines) in the raw data block files. Settling transients are caused by the subject locating fingers in the mold and then relaxing their fingers just enough to maintain contact with the mold with dropping it.
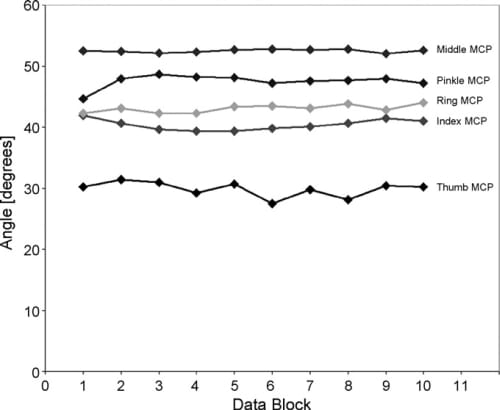
Fig. 8. Individual data block averages for a single subject for repeatability Test A. Each value is the average of 10 individual grip-release cycles. The difference between the maximum and minimum values for each joint are used to calculate the measurement ranges for this subject.
From these data, the range and standard deviation for each subject were computed (Fig. 9). The average range is the difference between the largest data block value and the smallest data block value over the entire test for each subject. Repeatability is generally reported as the standard deviation of the ranges. These values are shown for Test A (Fig. 9a), and Test C (Fig. 9b). In all cases, the average flat hand repeatability (Test C) for all subjects is better than the grip repeatability (Test A). Average repeatability results for all subjects (N=5) in Test A is s = 1.61° and in Test C is σ = 0.50°, for an average of 1.05°. Range results were Test A= 5.22°, and Test C = 1.49°,
for an average of 3.36°. These data appear in Table 2.
Results for individual digits for all subjects are shown in Fig. 10; the thumb MCP measurements show the highest standard deviation for the grip test (Test A), and all digits are similar for the flat hand test (Test C).
3.2. Reliability analysis
ICC analysis was performed for each test individually, and for each sensor. For Test A, the average ICC for each MCP joint ranged from 0.933 to 0.980 with an overall average of 0.955±0.091. For Test C, the average ICC for each joint ranged from 0.794 to 0.992 with an overall average of 0.937±0.172. The ICC values (Table 3) were very consistent from one data block to another with no particular joint showing significantly lower reliability than the mean.
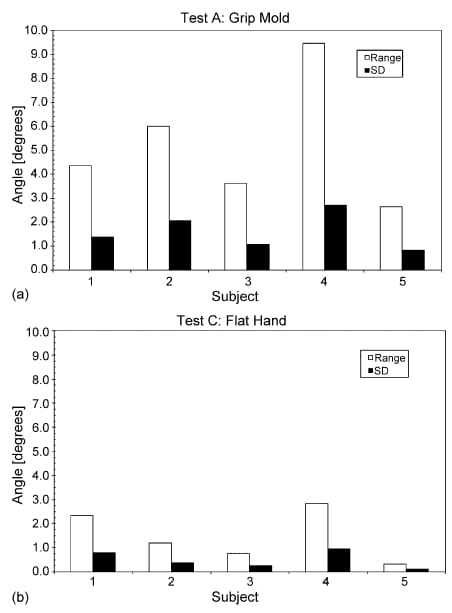
Fig. 9. Average range and standard deviation (S.D.) (°) measured for each subject and each repeatability test for Test A (a) and Test C (b).
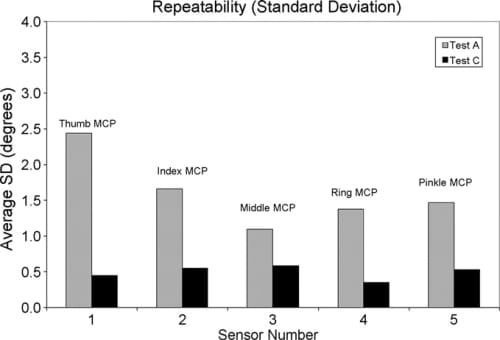
Fig. 10. Average repeatability standard deviation for each joint measured.

Table 2 – Comparison of repeatability results

Table 3 – Intraclass correlation coefficient of reliability
3.3. Wireless communications systems testing
For the first test condition, immediate transmission of sampled data, no more than one consecutive sample was lost at a time, throughout the entire sampling period. Altogether 1.1% of the total samples were not received (see Table 4). For the second test condition, transmission following completion of all sampling, all samples were transmitted and received the first time. No samples were missed, for a total error rate of 0.0%. The duration of tests 1 and 2 was approximately 10 min, 46 s each, and a high signal strength at the receiver was verified before testing was initiated.
For the final test condition, concurrent sampling and transmission of stored data, the overall transmission error rate was 1.2%. The bulk of this error was due to single missed samples (1.1%), although there were 3 instances in which up to 3 consecutive packets were not received, and 24 instances when 2 consecutive samples were lost. After 15 min when the devicewas brought back into range, it took an additional 37 min to transmit the stored data while simultaneously sampling new data. Signal strength was high for all tests, except when the monitor was specifically taken out of range for test 3.
In anticipation of using higher sampling rates and longer messages (for additional sensor values), additional testing was performed to evaluate Mode 1 error rates for sampling rates up to 100 Hz, while sending messages capable of supporting data from nine simultaneously-sampled sensors. Sampling rates up to 75 Hz showed small errors (25 Hz: 1.1%; 50 Hz: 1.7%; 75 Hz: 1.9%), while the error rate jumped significantly for sampling rates 100 Hz and higher (100 Hz: 50.2%). A separate test in Mode 2 (Sample and Save) using the same message size showed small errors for post-data collection transmission from onboard memory up to 75 Hz (25 Hz: 0.76%; 50 Hz: 0.79%; 75 Hz: 0.83%). The error rates for Mode 2 are slightly lower because the data storage algorithms monitor transmission receipts and initiate resending of missing data if possible. Overall, with the current software, 75 Hz is a realistic upper limit for data transmission without significant error rates.
3.4. Battery life testing
During battery life testing, the arm unitwas kept within range of the base station for the entire test (except for short intervals to ensure that the three wireless link modes continued to operate properly, totaling less than 2% of the testing time). Battery life testing using two new alkaline AA batteries yielded a total battery life of 59.75 h, or 2.49 days.
3.5. User feedback questionnaire
Subjects responded positively to most questions, with mean scores between 5.6 and 6.9 out of a maximum score of 7 (see Table 5). Comfort and ease of donning were significant goals. Questions 1, 2, 10 and 11 addressed comfort during the donning and removal process; average responses for all subjects were positive (6.6±0.3). Comfort wearing the monitor while performing activities was captured with questions 3, 5, 6, 7, 8, and 9; subject responsewas also very positive (6.6±0.2). Responses were not significantly different between the healthy group and the group with brain injury. Although the questionnaire contains negative phrases, the wording is positive and may serve to bias the results. However, the individual responses from this questionnaire are not being used as outcome variables or predictors for participant performance; instead, they have been used to initiate open-ended conversation regarding the wearer’s experience in order to make improvements to the device.
Only three questions generated significant discussion. Question 3 (individual responses ranging from range 2 to 7) was deemed to be poorlyworded. After explaining to subjects that we were interested in how restrictive this glove felt, many thought the question was confusing because the current device is not a “glove.” Question 4 regarding wearing the glove in public generated discussion (scores from 1 to 7) ranging from “embarrassing”, “it looks funny”, “would feel funny wearing only one glove” to “would wear it out”, “no problem wearing it”. Interestingly, four subjects suggested covering the individual sensors with a traditional glove of some sort to make it less noticeable. These were mostly healthy individuals who did not realize the challenge that donning gloves can be for individuals with restricted hand motion. The notion of color was also a popular topic, generating several fashion-oriented suggestions to make the entire device the same beige color as the current sensor sleeves, or to make it all black because “black matches everything.” As with orthodontic braces and cast selections, providing a variety of colors for people to choose from was another option. Participant feedback also prompted a change in how the device is worn; we originally mounted the arm unit on the forearm, but after participant recommendations we found that an upper arm mount is more comfortable and less obtrusive.

Table 4 – Wireless error rates for three test conditions
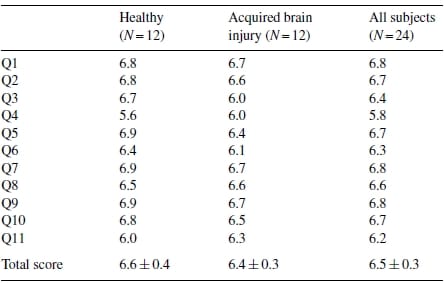
Table 5 – User feedback questionnaire: mean scores per question
Finally, question 11 (scores from 2 to 7) brought several comments about the double sided tape being used to secure the sensors to the fingers. Many individuals felt some discomfort as the tape was removed; it was likened to “pulling off a bandaid,” although one individual felt it was more painful than a band-aid. Another offered that the tape made the skin feel dry after removal. We have explored both double-sided toupee tape (Topstick® [Vapon, Inc., Fairfield, NJ]) and double-sided “skin friendly” pressure sensitive adhesive (TP9720 [MACTac Technical Products, Stow, OH]) and found that both were acceptable; however, the TP7920 was stronger and may be more durable for extended data collection sessions outside the clinical setting.
4. Discussion
The Shadow Monitor was evalua
ted for repeatability, reliability, wireless transmission, user acceptance, and battery life.
While both Immersion Corporation and 5DT have released commercial wireless gloves with a forearm-mounted form factor similar to the Shadow Monitor, battery life was much longer for the Shadow Monitor. The Shadow Monitor transmitted continuously for nearly 60 h, significantly outperforming both the Data Glove Ultra Wireless (reported in company literature at more than 8 h) and the Cyberglove II (reported at 3 h) for continuous wireless use on one set of batteries. With the Shadow Monitor battery life, an individual can be fitted with the glove and sent home for several days, allowing researchers to explore multi-day activity to yield a more realistic snapshot of home and community activities.
The longer battery life was a direct consequence of the selection of the IEEE 802.15.4 wireless protocol for the Shadow Monitor, as opposed to the Bluetooth® (IEEE 802.15.1) wireless protocol used by both commercial devices. Bluetooth® provides more functionality than is actually needed for our application, at the cost of battery life. The Bluetooth® protocol supports data rates up to 1000 kilobits per second (kbps), but it uses at least 250KB in system resources (Adams, 2004). Conversely, Zig- Bee/802.15.4 can support data rates only up to 250 kbps, but it uses a mere 28KB of system resources, roughly one-tenth of the resources required by Bluetooth®. These lower benchmarks are directly coupled to lower power consumption requirements. In fact, a key feature of the protocol is extended battery life in remote operations that do not require high data rates or user intervention. Error rate testing show acceptable performance for all three data collection modes at 25 Hz. Additional testing to explore use of the monitor at higher sampling rates shows a similarly low error rate up to 75 Hz for messaging packets sizes that support simultaneous sampling of nine sensors.
Additional advantages for the Shadow Monitor for the specific application of home monitoring of hand usage in individuals with disability include ease of placing the system on the user and cost. Due to the commonly flexed posture of the hand following stroke, gloves can be very difficult for stroke survivors to don. In contrast, the Shadow Monitor sensors were easily applied to all of the subjects with ABI in this study. User acceptance for the Shadow Monitor was high. The questionnaire generated discussion on a variety of topics, and we found that participants, including those with brain injury and restricted range of motion, reported that the monitor was comfortable to don and to wear, and that it did not restrict motion. We also found that participantswould generally wear the device in public and appreciated being asked how to improve it. From that discussion, we found that the easiest solution is to offer several colors including black and beige, which is trivial since the sensor sleeves are very low cost, interchangeable, and easy to manufacture. We struggle against the perception that this should look like a traditional glove, and will explore adding an outer sheath to mimic the look of fingertip-free gloves without sacrificing loss of palmar sensation. Flexibility in forearm and upper arm mounting, suggested by a participant, increases its usability. We are encouraged that participants’ responses to the questions were similar regardless of diagnosis or functional ability.
At this time, the 5-sensor wireless Data Glove runs US$ 2490 and the wireless 22 sensor Cyberglove costs US$ 14,000. The Shadow Monitor costs US$ 300, with the large majority of this cost associated with the Tmote. The sensors are sufficiently inexpensive that they can be considered disposable for the intended studies, thereby providing a much more robust system. Thus, users can use their hands without restrictions created by the fear of damaging the device.
The repeatability and reliability of the three devices, however, are similar. The Shadow Monitor showed an overall error range of 3.4° (five subjects) for Tests A and C as compared to 5.5° for the Data Glove (five subjects) and 5.7° for the Humanglove (six subjects) for the same tests (Table 2). The DataGlove results do not include data collected from the thumb sensors because the thumb joints were not stabilized in the mold. Based on these findings, we were careful during mold construction to encase the thumb as much as possible. Despite the somewhat higher variability we also observed, thumb values have been included in our results.
In addition, the standard deviation was comparable for the Shadow Monitor (1.1°) versus 2.1° for the DataGlove and 1.8? for the Humanglove (Table 2). The results for all three gloves are within the reported measurement reliability of manual goniometry with skilled therapists (within 7°) (Wise et al., 1990). The SIGMA glove (a Lycra® glove with embedded Abrams-Gentile bend sensors) has also been evaluated for measurement repeatability using a similar protocol with custom molds, although average range and standard deviation using the same analysis are not reported. Glove measurements were reported as consistent (R2 > 0.84) with an average coefficient of variation of 7% across all sensors, although the exact consistency statistic used is not clear (Williams et al., 2000).
Reliability analysis showed high ICC values for all channels within 0.79–1.00 with an overall average of 0.95. This is comparable to ICC analysis performed for the Humanglove, which showed that almost every channel had an ICC between 0.70 and 1.0 (Dipietro et al., 2003). No similar analysis was reported for the Data Glove.
Calibration is challenging in several regards. It must be performed for each joint and each subject. Joint angles are measured by placing the goniometer over the sensor sleeve and the joint. However, we found it difficult to physically read the goniometer value without pressing on the sensors or twisting the hand and fingers slightly. This can introduce a small amount of measurement error because the ends of goniometer may press against the sensor, causing a small deformation that changes the measured voltage. Some values were measured multiple times to avoid this. We will explore alternate methods to assess joint angle for calibration purposes.
Secondly, because the voltage–angle relationship is nonlinear, the fixed voltage resolution (defined by the hardware and ADC settings) of approximately 1.2mV maps into different angular resolutions over the entire operating range. At midrange where the instantaneous slope is larger, this corresponds to an angular resolution of approximately 0.06°. At the endpoints where slope may be much less, angular resolution averages 0.22°, which is still quite acceptable. At the extreme, the endpoint resolution of one sensor on one subjectwas over 3° (=4.6°).
Thirdly, hyperextension (and calibration in this region) is particularly challenging for most sensor gloves and devices. Most sensors do not work correctly in the reverse (hyperextension) direction. The Flexpoint sensors do continue to provide the correct relationship (greater hyperextension corresponds to decreasing resistance), although the magnitude of the voltage change with bend angle decreases significantly. For the study including 10 healthy subjects and 10 subjects with ABI, 5 sensors were used for each subject. After calibration of each sensor for each trial (20 trials × 5 sensors/trial = 100 calibrations), the resultant angular resolutions over the hyperextension range 0? to -30° averaged 0.5°. Seven of the sensors had angular resolutions exceeding 3° (mean angular resolution = 10.7°). (It should be noted that the interpolation interval of 0.1° is not related to these values; it is simply a MATLAB selectable parameter and cannot provide additional resolu
tion over that dictated by the ADC subsystem.) For many individuals, no hyperextension and only moderate flexion data could be collected due to disability level, so the hyperextension issue was not a factor. However, we plan to revisit the sensor configuration in cases where high resolution in hyperextension is needed.
The repeatability protocol proposed byWise et al. (1990) and refined by Dipietro et al. (2003) has some previously reported limitations that we have also found, and we are in agreement that this protocol is not very precise and repeatability results are affected by factors other than those caused solely by the instrument. For example, increased grip strength results in different finger and wrist positions, and subsequently different joint angle measurements, as noted by others (Dipietro et al., 2003; Wise et al., 1990). These human-related sources of errors can only be minimized using a custom grip mold and conveying the goal of the experiment to the subject before beginning; these errors cannot be completely removed, and their effects cannot be separated from those instrument-only effects. Although the mold was designed to stabilize grip in one position, we found that it did not stabilize the joints as well as did the flat handed position. This observation was also reported by Dipietro. Despite these shortcomings, the protocol appears to be a valid method to (1) evaluate a measurement glove device while it is being worn, and to (2) compare results with other reported glove analyses The current implementation of the system was limited to five sensors. This number can easily be expanded to eight sensors without any changes to the hardware, and even beyond eight sensors with the addition of a small circuit board to multiplex additional sensor inputs into the 8-channel analog-to-digital converter on the Tmote. The Flexpoint bend sensors can be fabricated to any desired length, so multiple sensors can be used on each digit.
Expansion beyond eight channels, however, may not always be needed. Studies investigating hand postures, using between 4 and 14 sensors with different constraint assumptions and processing methods, suggest that a reduced sensor set may be appropriate. Reducing the high dimensionality of the data has been accomplished using methods such as principal component analysis (PCA), neural networks, and recognizing position constraints due to biomechanics and hand anatomy. Jerde et al. (2003) used PCA to identify the 4 critical degrees of freedom from 17 joint angles measured during finger spelling (American Sign Language manual alphabet), and reported an accuracy of 86.6% using thumb abduction, index and middle proximal interphalangeal flexion, and ring metacarpophalangeal flexion measurements). Similarly, Mehdi and Khan (2002) reported 88% accuracy using a neural network model on inputs from a 7-sensor glove (1 bend sensor for each finger, plus hand tilt and hand rotation), and Fels and Hinton (1997) used eight flexion angles, thumb abduction and thumb rotation to translate hand gestures to speech. Even when a large number of sensors are used, not all yield significant results or are reported. Adamovich et al. (2004) measure 14 d.f. in the affected hand of individuals post-stroke, but report average range of motion and speed across all four fingers as a measure of improvement in virtual realitybased hand rehabilitation. Interdependencies among fingers and joints during common hand postures also allows a reduction in independent inputs needed to estimate hand postures (Lin et al., 2000). These results suggest that using a reduced set of degrees of freedom can still yield useful and significant results, especially for rehabilitation applications evaluating significantly fewer hand postures than reported above.
Our pilot studies using five sensors are based on research suggesting that reducing the degrees of freedom can yield reasonably accurate results with a significantly lower measurement and data processing burden. We are able to discriminate among different types of hand function activities, and have reported a significant difference in finger range of motion during daily activities between individuals with brain injury and healthy individuals using this reduced sensor set (Simone et al., 2006). Additionally, our device provides the option to choose the joints of interest.
5. Conclusion
The Shadow Monitor provides several advantages over other proposed and evaluated systems and over manual goniometry. First, the ShadowMonitor accommodates all hand sizes. Despite varying hand sizes and the inclusion of both genders, we did not need to segregate results based on hand size, which was done for both the DataGlove and Humanglove in order to account for gloves that did not fit snugly on female subjects (Dipietro et al., 2003; Wise et al., 1990).
A second advantage is the unique method of sensor application. This method makes donning the device simple for any hand position because joints do not need to be flexed in order to apply the sensors. In addition, only the joints of interest need to be measured, leaving the others free of obstruction. Existing gloves can be extremely challenging or painful for individuals with hand disabilities to don, and the Shadow Monitor addresses this underserved need. Individuals with brain injury reported that the glovewas comfortable and that their fingers were not put into an uncomfortable position as the glove was put on.
We identified some disadvantages of this device, including some concern about wearing it in public and post-removal itchiness of the double sided tape. In addition, the midrange angular measurement resolution of approximately 0.06° decreases at the endpoints to an average of 0.5° in hyperextension, requiring that care must be taken to ensure that this device is acceptable for the desired application. Currently, the monitor must be applied by trained investigators to ensure correct sensor placement and to perform calibration.
The long-term clinical application of this research is to explore everyday finger posture at rest and during the performance of active and passive functional tasks, especially following therapeutic interventions, in individuals with acquired brain injury. Monitoring that can occur during the course of a day, at home and in the community, would provide valuable information to evaluate impaired hand function of both passive and volitional activities. Quantitative real-time measurements can document the effects of an intervention (e.g., pharmacologic, therapeutic or chemoneurolytic) by correlating functional abilities with specific task performance, such as fine motor control or the use of a key or hand in a functionally assistive manner. Other applications include telerehabilitation, assessing compliance with physical therapy programs, and non-rehabilitation related applications such as virtual reality and gaming, and as a computer input device.
One of the primary goals for this studywas to evaluate several measurement parameters of the Shadow Monitor, and to evaluate its usefulness and comfort in capturing hand postures during daily activities. The repeatability of measurement is comparable to other semi-goniometric gloves reported, indicating that the Shadow Monitor can also be considered for rehabilitation applications to assess hand posture during functional tasks. User feedback and extended battery life support its acceptance as a long-term measurement tool for use outside the clinic.
Future work will include accuracy assessments and extended data collection over multiple days. Sensors for thumb abduction and rotation will be added in order to better capture thumb contributions to hand posture, and a low memory indicator will be added to remind the wearer to return to the receiving computer to prevent data loss. Additional sensor lengths will be evaluated (currently, 3″” sensors are used;
1″ and 2″” are available for smaller joints). Eight sensors are easily supported with the current hardware; additional sensors would require the addition of a small daughter board. Testing has shown the addition of several sensors will not adversely affect transmission rates. In addition, data analysis methods will be developed to characterize the functional activities performed in other parts of the study protocol.
The advances in technology have continued to improve diagnostic and measurement tools, ultimately leading to better health care. However, healthcare costs continue to escalate, pointing to a need for low-cost, easily deployable solutions that can be distributed to as many people as possible. In addition, uneven healthcare coverage based on individual’s economic and geographical status highlight the need for more decentralized care and attention to preventative and wellness programs (Park and Jayaraman, 2003). Technology has been proposed to address these needs such as via the creation of wearable monitoring systems and the use of the internet for decentralization and access. The Shadow Monitor has been designed with these goals for pervasive deployment.
Acknowledgements
This materialwas based onwork supported by the Foundation of University of Medicine and Dentistry of NewJersey (#29-05), the Henry H. Kessler Foundation, the Coleman Foundation, and the National Institutes of Health (NIH 1 R24 HD050 821-01). The authors wish to thank Brad Galego for his contribution.
References
- Adamovich SV, Merians AS, Boian R, Tremaine R, Burdea GS, Recce M, et al. A virtual reality based exercise system for hand rehabilitation post-stroke: transfer to function. In: Proceedings of the 26th annual international conference of the IEEE EMBS; 2004.
- Adams J. Meet the ZigBee standard. Sensors Online 2004 [cited December 29, 2003]. Available from: www.sensormag.com.
- Asada HH, Mascaro S. Fingernail touch sensors. MIT home automation and healthcare consortium, Progress Report no. 2–4, October 1, 1999. Bohannon R, Smith M. Interrater reliability of a modified Ashworth scale of muscle spasticity. Phys Ther 1987;67(2):206–7.
- Castro MCF, Cliquet Jr A. A low-cost instrumented glove for monitoring forces during object manipulation. IEEE Trans Rehabil Eng 1997;5(2):140–7. Darling WG, Cole KJ, Miller GF. Coordination of index finger movements. J Biomech 1994;27(4):479–91.
- Dipietro L, Sabatini AM, Dario P. Evaluation of an instrumented glove for handmovement acquisition. J Rehabil Res Dev 2003;40(2):179–90.
- Durlach I, Mavor AS. Committee on virtual reality research, commission on behavioral development, social science, mathematics education, commission on physical sciences, and applications, national research council. In: Virtual reality: scientific and technological challenges. National Academy Press; 1994. p. 189.
- Fels SS, Hinton EG. Glove-talk II—a nural-network interface which maps gestures to parallel formant speech synthesizer controls. IEEE Trans Neur Netw 1997;8(5):977–84.
- Fowler N, Nicol A. Long-term measurement of metacarpophalangeal joint motion in the normal and rheumatoid hand. Proc Inst Mech Eng 2001;215(Part H6):549–53.
- Hofmann F, Henz J. The TU-Berlin Sensor Glove. Diploma thesis, 1995, Technische Universit¨at Berlin. https://pdv.cs.tu-berlin.de/forschung/ SensorGlove2 engl.html.
- Hume MC, Gellman H, McKellop H, Brumfield RH. Functional range of motion of the joints of the hand. J Hand Surg 1990;15A:240–3. IEEE 802.15.4 Standard Specification: Wireless Personal Area Networks, 2003 [cited December 30, 2005]. Available from: https://standards.ieee.org/ getieee802/802.15.4.html.
- Jerde TE, Soechting JF, Flanders M. Biological constraints simplify the recognition of hand shapes. IEEE Trans Biomed Eng 2003;50(2):265–9. Jovanov E, Milenkovic A, Otto C, de Groen P. A wireless body area network of intelligent motion sensors for computer assisted physical rehabilitation. J Neuroeng Rehabil 2005;2(1):6.
- Jurgens J, Patterson PE. Development and evaluation of an inexpensive sensor system for use in measuring relative finger positions. Med Eng Phys 1997;19(1):1–6.
- Karlsson N, Karlsson B, Wide P. A glove equipped with finger flexion sensors as a command generator used in a fuzzy control system. In: Proceedings of the IEEE instrumentation & measurement technology conference; 1998. p. 441–5.
- Lang C, Schieber M. Differential impairment of individuated finger movements in humans after damage to the motor cortex or the corticospinal tract. J Neurophysiol 2003;90(2):1160–70.
- Lang CE, Schieber MH. Reduced muscle selectivity during individual finger movements in humans after damage to the motor cortex or corticospinal tract. J Neurophysiol 2004;91:1722–33.
- Li S, Latash ML, Yue GH, Siemionow V, Sahgal V. The effects of stroke and age on finger interaction in multi-finger force production tasks. Clin Neurophysiol 2003;114:1646–55.
- Lin J, Wu Y, Huang TS. Modeling the constraints of human hand motion. Proc IEEE Workshop Hum Motion 2000:121–6.
- Mallon WJ, Brown HR, Nunley JA. Digital ranges of motion: normal values in young adults. J Hand Surg 1991;16A:882–7. Mason CR, Gomez JE, Ebner TJ. Hand synergies during reach-to-grasp. J Neurophysiol 2001;86:2896–910.
- Mehdi SA and Khan YN. Sign language recognition using sensor gloves. In: Proceedings of the 9th international conference on neural information processing (ICONIP’02); 2002(5). p. 2204–6.
- Merians A, Jack D, Boian R, Tremaine M, Burdea G, Adamovich S, et al. Virtual reality-augmented rehabilitation for patients following stroke. Phys Ther 2002;82(9):898–915.
- Merians AS, Poizner H, Boian R, Burdea G, Adamovich S. Sensorimotor training in a virtual reality environment: does it improve functional recovery poststroke? Neurorehabil Neur Repair 2006;20:1–16.
- Moler CB. Numerical computing with MATLAB. Philadelphia: Society for Industrial and Applied Mathematics; 2004, Ch 3, p. 8–17.
- Park S, Jayaraman S. Enhancing the quality of life through wearable technology. IEEE Eng Med Biol Mag 2003;22(3):41–8.
- Rand DT, Nicol AC. An instrumented glove for monitoring MCP joint motion. Proc Inst Mech Eng [H] 1993;207(4):207–10.
- Simone LK, Kamper DG. Design considerations for a wearable monitor to measure finger posture. J Neuroeng Rehabil 2005;2(1):5.
- Simone LK, Sundarrajan N, Elovic E, Kamper DG. Measuring passive, active, and functional range of motion following brain injury using a low-cost wearable monitor. In: Proceedings of the RESNA 29th international conference; 2006.
- Van Galen GP, Van Doorn RR, Schomaker LR. Effects of motor programming on the power spectral density function of finger and wrist movements. J Exp Psychol Hum Percept Perform 1990;16(4 November): 755–65.
- Williams N, Penrose J, Caddy C, Barnes E, Hose D, Harley P. A goniometric glove for clinical hand assessment. J Hand Surg 2000;25B(2):200–7. Wise S, GardnerW, Sabelman E,Valainis E,WongY, Glass K, et al. Evaluation of a fiber optic glove for semi-automated goniometric measurements. J Rehabil Res Dev 1990;27(4):411–24.
- Zurbr¨ugg T. Dynamic Grasp Assessment for Smart Electrodes (GRASSY). Semester Thesis. ETH Zurich (Swiss Federal Institute of Technology), Department of Information Technology and Electrical Engineering, 2003. https://www.wearable.ethz.ch/grassy.0.html#.


