Cadet 1st Class Tyler Olmstead and Cadet 1st Class Erika Fischer
U.S. Army Engineer Research and Development Center Cold Regions Research and Engineering Laboratory
72 Lyme Road
Hanover, NH 03755-1290
Prepared for: Headquarters, U.S. Army Corps of Engineers Washington, DC 20314-1000
Under: Work Unit GLJ53C P2 149875
Abstract
This report describes a preliminary study in support of ongoing research to model soil stress resulting from vehicular traffic on unpre-pared ground. The soils used in this study were sand, wet sand, and silt. The soils in the prepared soil beds were first characterized as to strength, density, and plasticity. Then pressure sensors were embedded at depths of 2 and 5 in. These were then traversed several times by a Mine Detonation Trailer (MDT) and the pressure produced by a single chosen wheel re-corded. The actual measured load of this wheel was 4700 pounds. The same series of measurements were made using the CRREL Instrumented Vehicle (CIV) with a measured wheel load of about 1500 pounds. The re-sults were compared with the expected values calculated using the Froeh-lich modification of the Boussinesq equation. For the MDT the correspon-dence was very good for the sand tests, and acceptable for silt. However, for the CIV the correspondence was unsatisfactory, underpredicting by a significant amount. The Federal Aviation Administration�s Layered Elastic Analysis (LEAF) program was also applied to the MDT case and yielded results similar to the MDT Boussinesq analysis. Possible causes for the ob-served discrepancies are suggested.
Nomenclature
P Point load applied
R Radius of assumed circular loaded area
r Radial distance between load and point of interest
W Total weight
z Vertical distance between point load and point of interest
0σ Mean stress on the soil surface
v Froehlich concentration factor
Preface
This report was prepared by Tyler Olmstead and Erika Fischer of the United States Air Force Academy during a temporary duty assignment at the Cold Regions Research and Engineering Laboratory (CRREL) in Hanover, NH. Funding for this work was provided by the Engineer Re-search and Development Center (ERDC), CRREL, Hanover, NH.
The authors thank Sally Shoop and Barry Coutermarsh for their guidance, and Mike Parker, Rosa Affleck, Charlie Smith, and Jesse Stanley for assis-tance with the experiments.
This report was prepared under the general supervision of Dr. Justin B. Berman, Chief, Research and Engineering Division, CRREL; Dr. Lance D. Hansen, Deputy Director, CRREL; and Dr. Robert E. Davis, Director, CRREL.
At the time this work was performed, COL Richard B. Jenkins was Com-mander and Executive Director of ERDC. Dr. James R. Houston was Di-rector.
Unit Conversion Factors
| Multiply | By | To obtain |
| degrees (angle) | 0.01745329 | radians |
| feet | 0.3048 | meters |
| inches | 0.0254 | meters |
| miles per hour | 0.44704 | meters per second |
| pounds (mass) | 0.45359237 | kilograms |
| square inches | 6.4516 E-04 | square meters |
| tons (2,000 pounds, mass) | 907.1847 | kilograms |
1 Introduction
Throughout the past century, various methods of modeling and sensing soil stress distributions have been explored. Notably, Boussinesq in 1885 created a general solution of the elastic distribution of stress under a pointload applied to a semi-infinite mass, and O.K. Froehlich in 1934 introduced the concentration factor that alters a soil�s Boussinesq stress distribution based on soil strength (Gill 1967). Advances in technology allow soil scientists and civil engineers to assess soil conditions in ways not possible only a few decades ago. For example, vehicle sensors and pressure sensing pads assist engineers in testing soil strength when subjected to vehicle and (in the interest of the U.S. Air Force) aircraft loading, specifically on unpaved surfaces.
Research at the U.S. Army Engineer Research and Development Center�s Cold Regions Research and Engineering Laboratory (CRREL) in Hanover, NH aims to determine the status of soil stress distributions specifically when loaded by a Mine Detonation Trailer (MDT). The Army is concerned with stress that a mine will experience as the MDT rolls over a minefield area. If the MDT does not detonate a dangerously located existing mine, then soldiers may pay the price. Extensive study has been conducted in Europe to increase knowledge of soil dynamics during heavy tractor tire loading. These studies were driven by the desire to improve crop yields in the field of agriculture. For unspecific reasons, such research and development has not existed in large quantity in the United States. Although this study is not concerned with improving crop yields, for analytical purposes, the large, lugged tires of the MDT are strikingly similar to heavily loaded tractor tires studied in Europe.
Consideration also is given to the loading of unpaved roads by passenger vehicles. The CRREL Instrumented Vehicle (CIV) proves to be a ground vehicle with ample instrumentation and sensing capability to model (1) vertical stress in soil based on passenger vehicle travel and (2) horizontal resistance force that soil exerts on a vehicle during traction testing. The latter is of specific interest to the U.S. Air Force, which wants to understand the difficulties being encountered by its intra-theater airlift capabilities (e.g., C-130s and C-17s) taking off and landing on unpaved and semiprepared airfields. CRREL testing implements pressure pads produced by Sensor Products, Incorporated, and sensing equipment on the CIV to help solve the aforementioned problems during rolling and traction tests. Stress equations made famous by Boussinesq and O.K. Froehlich are used to compare results obtained by the pressure pads. Also, computer-based stress modeling such as the Federal Aviation Administration�s Layered Elastic Analysis (LEAF) model serves as another source to compare results.
This report presents the results of the following tasks performed in multiple soil conditions:
- Evaluate soil stress at given depths when trafficked by the MDT;
- Evaluate soil stress at given depths when trafficked by the CIV;
- Evaluate soil stress in tracti
on tests performed by the CIV; - Estimate stress values using Boussinesq and Froehlich equations;
- Predict stress values using LEAF program.
2 Testing Procedures
All field tests, unless otherwise mentioned, were conducted on a man-made, built-up test section west of the Frost Effects Research Facility (FERF) on the CRREL site. The test section is made up of three parts, each with its own type of soil. The first part is sand (USCS designation SM�silty sand). The second part is silt (USCS designation ML�low plasticity silt). The last part is made up of clay. No testing was conducted in the clay. The test section was built with a four-degree side slope from east to west to allow for easier drainage. Images of the test section and portions of the test procedure can be found in Appendix C.
In-situ sand testing
The first test was conducted 27 May 2008 on the sand. One of the pressure pads (from Sensor Products, Inc.) was buried at 2-in. depth. The second pressure pad was buried at 5-in. depth. The distance between the closest edges of the pads was 6 ft to prevent the one pad from being affected while the soil above the other pad was loaded. Some of the in-situ soil was sifted using an ASTM number four sieve and placed directly above and directly below the neoprene pads to prevent punctures by rocks as the vehicles passed over them. Care was taken to try to return the disturbed soil around and above the pad to original compaction. Walking on the soil and hand tamps were used to compact the soil. The position of the pads was marked by spray paint on top of the soil. The pads are connected to a laptop via a set of wires. Pad A must be connected to 50 ft of wire for calibration reasons and Pad B must be connected to 100 ft of wire for the same reason. The field laptop runs software called Tactilus®, which records what pressure the pads are feeling when loaded. After the pads were buried, soil properties were obtained. The sand�s modulus of elasticity was obtained using a Loadman apparatus. California Bearing Ratio (CBR) was obtained using a dynamic cone penetrometer (DCP). Wet and dry densities and moisture content of the soil were obtained using a Troxler Nuclear Gauge. The results of all of these tests can be found in Appendix A. Finally, rolling tests were ready to begin. The goal of the test was to have the right tire of the fourth axle of the MDT roll over the area directly above the pad. Four acceptable passes over the test section were made at five miles per hour with the MDT, which was being pulled by a Heavy Expanded Mobility Tactical Truck (HEMMT). The passes were recorded on the Tactilus® software. Screen shots of these passes can be found in Appendix B.
Wet sand testing 1
On 28 May 2008, testing continued in efforts to replicate the procedure accomplished on the 27th. However, it was desired to obtain data with higher moisture content. The test section was left alone from the previous day. Because it did not rain as was hoped the night before, the test section was watered with a hose before testing resumed. After repeating the experiment, the pads were dug out of the existing location. Upon removal, it was noted that the sand immediately below the pads had noticeably different moisture content as a result of the impermeability of the pads. Also, during the testing, it was noted that the test section had been subjected to quite a bit of rutting and the test section was not as level as it should be. Because of these factors, it was decided to repeat the �wet� sand testing on the following day after the pads were removed, the test section was graded to be smoother, and a uniform amount of water could be applied to the sand. The test section was heavily drenched to simulate a rainstorm later in the afternoon.
Wet sand testing 2
On 29 May 2008, the test section was graded using a bulldozer and rakes to remove all ruts, which caused bouncing and non-uniformity of the test section on the previous day. During the regrading of the test section, it was noted that the sand had drained exceptionally well because of the sand�s in-situ volume of voids and permeability. Therefore, a couple of hours before testing, the sand was wet again with a hose as uniformly as possible to simulate a rainstorm. The test procedure was duplicated, with pads buried again at 2- and 5-in. depths. The results from testing the soil properties are given in Appendix A. After four rolling tests with the MDT, the CIV took over the test section. First, the CIV conducted four rolling tests, followed by three traction tests. It should be noted that the test section was compacted more than original compaction by the traffic of the HEMMT and MDT for the CIV testing. The traction test was conducted by getting the tires spinning while over the pressure pads. The rear wheels of the CIV were disengaged from the drive train. All engine torque was applied to the front two wheels. Consideration was taken to make sure that the pads (especially the pad buried at only 2-in. depth) were not torn from the ground during the traction tests. The CIV displaced a noticeable amount of soil during the traction tests, and torn or broken pads are not desired.
Silt testing
After testing the sand at two different moisture contents, the focus of the testing shifted to the silt portion of the test section. The pads were once again buried at 2- and 5-in. depths. Because of the higher cohesion of silt, silt was sifted using the ASTM number four sieve on a night preceding the test because of impending rain. After the rain, the silt would have been extremely difficult to sift as its cohesion properties do not easily allow passage through the holes in the sieve. For this reason, the silt immediately under and above the pads had a lower moisture content in order to provide silt with larger objects removed to prevent puncture of the neoprene. The tests were set up the same and four rolling tests were accomplished with the MDT. The CIV accomplished three rolling tests and one traction test. The traction testing was cut short because Pad A (buried at 2-in. depth) was exposed after the first traction trial. In interest of the integrity of the equipment, further traction tests were abandoned in the silt that day.
3 Pressure Pad Problems/ Hard Surface Tests
Following these tests, the pressure pads were tested to determine baseline values to be used in calculations. The pads were set up in series before the right tire on the fourth axle of the MDT. The area used for this test was clean, flat asphalt for approximately even weight distribution.
As the MDT tire rolled over each of the pads, the Tactilus® software showed the total force exerted on the pad by the tire. Pad A showed approximately 4200 pounds, around the expected value. Pad B showed approximately 2000 pounds, as seen in Figure 1.
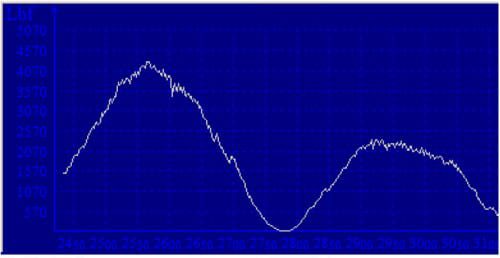
Figure 1. Force versus time for MDT on flat surface.
In the process of determining the cause of the discrepancy, the test was repeated with a passenger car in varying configurations. Box A was attached to Pad B (configured for 100 ft of cable), and Box B was attached to Pad A (configured for 50 ft of cable). The pads were laid on clean, flat asphalt. A passenger car of known weight was driven over each in succession, stopping in the center of each pad to obtain static data. The boxes were then switched in relation to the pads, so Box A was attached to the 50-ft pad A and Box B was attached to the 100-ft pad B. The test was conducted twice for each configuration for a total of four tests.
The data were compared to the factory-specified weight for the passenger car. The 100-ft
pad B provided consistently low figures, with forces typically half of the actual value. Pad B was deemed suspect and its results were not used in the analyses. The boxes seemed to make a small difference in the accuracy of the output, with Box A being more reliable.
4 Finding MDT Vertical Load
According to Manufacturer Data, the weight of the second Mine Detonation Trailer is eight metric tons (17,637 pounds) (U.S. Army 2007). If the trailer was perfectly symmetric, on level ground each tire would support a load of about 4409 pounds. Based on previous CRREL testing with the MDT, it was suspected that the rear axle on the MDT on the second trailer (fourth axle overall) supported more of the total load and the trailer must not have been symmetric. In order to use an accurate value for W in Equation 4, it was deemed necessary to find the load imparted by the right tire on the fourth axle while the MDT was in the test section. A small experiment was conducted to complete this task. A 5000-pound scale was buried in the test section in such a way that the top of the scale was even with the test section. When the MDT rolled on top of it, the scale showed that the tire in question imparts a load of 4700 pounds. It should be noted that whereas the test section is not level, the force was measured in the same manner that the testing was conducted�on the sloped test section.
While trying to make the best effort possible to determine the load on the soil above the pads, it must be noted that there is an important variable omitted from this analysis. The value of 4700 pounds was obtained statically from a scale. That value is likely not the value of the force imparted on the soil during each of the rolling tests. The test section was not perfectly flat, so the trailer would bounce slightly as it traveled through the test section. If the tire in question hit a bump and was accelerating up as it passed over a pad, then the force applied would be lower than 4700 pounds. If the tire was accelerating down as it passed over a pad, then the force applied would be higher than 4700 pounds. The value 4700 is simply the best estimate that can be made based on available data.
5 MDT Testing Results
Because of the aforementioned problem, only results from one pad (Pad A) are considered reliable. On 27 May, the first day of testing, Pad A was set up as the 5-in. depth pad. All wiring and setup configurations were correct, but Pad A was buried as the second (5-in.) pad. On all other days, Pad A was buried first at a depth of 2 in. The results from the testing are shown in Table 1.
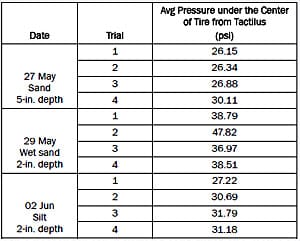
Table 1. Testing results.
Some consideration should be taken in accepting the values output by the Tactilus® software. Some difficulty exists to find the pressure directly under the center of the tire. The contact patches are usually spotty, and it is difficult to tell exactly where the center of the tire is. It was determined that the best method for obtaining this pressure was to take an average pressure in an area (29.76 in.2) that probably includes the center of the contact patch. In order to obtain the average pressure value, an ellipse drawing tool is used to isolate an area of applied pressure. See Appendix B for examples of this procedure and screenshots of the contact patch. The ellipse drawing tool can be seen as red lines drawn in the contact patches in Appendix B.
6 Froehlich�s Modification to Boussinesq Equation
CRREL is interested in finding a relatively simple equation to estimate the vertical stress in soil subjected to vehicle loading that can be implemented quickly in the field. Initially, an equation was explored for a non-uniform stress distribution under an elliptical contact area. This was most realistic as soil stress distribution is never uniform when loaded by such large tires with large lugs. Also, an ellipse is the most realistic shape for the contact area of these tires (Smith et al. 2000). In elliptic-cylinder coordinates the equation for such stress is

This method is admittedly much too complex for the desired result. Therefore, it was necessary to assume a uniformly loaded area and isotropic soil. Boussinesq�s original soil stress distribution equation proves much simpler (in polar coordinates):

However, in all its simplicity, Boussinesq fails to take into account soil properties such as differences in texture, moisture content, or Young�s modulus. Because soil is neither completely plastic nor completely elastic, O.K. Froehlich introduced a factor (called concentration factor) to modify Boussinesq�s equation based on its elasto-plastic properties (Smith et al. 2000):

where
v = Froehlich concentration factor;
P = point load applied;
z = vertical distance between point load and point of interest;
r = radial distance between load and point of interest.
The concentration factor, v, in the original Boussinesq equation and based on elastic soil, is 3. However, Soehne (1958) assigns values to the concentration factors based on soil properties. The concentration factor is 4 for hard soil, 5 for medium soil, and 6 for soft soil. However, Sharifat and Kushwaha (2000) suggest values of 3 for hard soil, 4 for normal soil, and 5 for soft soil. In this study, a concentration factor of 4 will be used.
If the modified Froehlich equation is integrated, the stresses in the sand or silt volume can be calculated at any point and for any load distribution in the contact area. Particularly for a uniform stress on a circular area (radius R), the remaining vertical stress at depth z below the center of contact area can be calculated by

where
σ0= W / πr2 = is the mean stress on the soil surface and W is total weight;
z = vertical distance between point load and depth of interest;
R = radius of assumed circular loaded area;
v = Froehlich concentration factor.
Using the published contact area for the MDT (0.05 m2 = 77.5 in2) (CSI nd) and W = 4700 lbs, values from the Froehlich equation for average vertical stress directly below the tire are shown in Table 2.

Table 2. Vertical stress calculated using the Froehlich equation (Equation 4).
Recall that Froehlich�s equation takes into account only the load, the contact area, the depth, and the concentration factor. A concentration factor of 4 was used for normal soil. The same load, contact area, and concentration factor are assumed whether the soil was sand, higher moisture sand, or silt. Therefore, the theoretical values change only for the first, original sand in-situ test because it is done at a depth of 5 in.
7 Comparing MDT Test Results with Predicted Values
When comparing values from the Froehlich equation to experimental values from the pressure pads, the Froehlich value does not change except for the change in depth. However, each test yielded a different value for the pressure pads. The comparison of the equation and experime
ntal values with their corresponding percent errors is presented in Table 3.
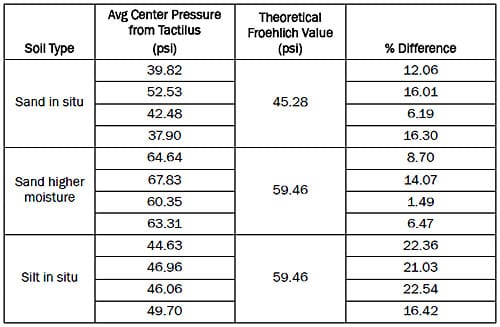
Table 3. Comparison between Froehlich equation and experimental values of vertical stress (pressure).
Because the experimental values change, perhaps the best way to examine the percent error is to average the experimental values. The results of this analysis are given in Table 4.

Table 4. Comparison of Froehlich values with average experimental values.
8 CIV Testing Results
The same analysis as conducted with the MDT was used to predict soil stress directly below the right front tire of the CIV at 2- and 5-in. depth. The force exerted on the test section is given by the vertical direction of a triaxial sensor located on the front right wheel of the CIV. However, the problem of the bumpy test section still exists with the CIV. If the tire hits a bump and was accelerating up as it passed over a pad, then the force applied would be lower than its level resting weight. If the tire was accelerating down as it passed over a pad, then the force applied would be higher than its level resting weight. This weight fluctuation is illustrated in Figure 2.
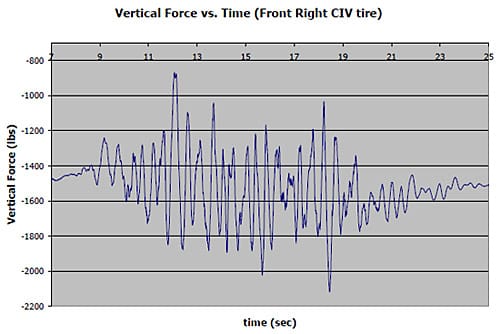
Figure 2. Vertical force versus time (front right CIV tire).
Figure 2 shows that fluctuations in vertical force did occur while the CIV was rolling through the test section. The maximum range of force is greater than 1000 pounds. The best chance for picking the correct value of vertical force involves collecting information from the operator of the CIV.
The CIV has the capability to display a pulse marker when the operator thinks the front right tire is directly above the pressure pad. However, this marker is not always present in the output data of the CIV. If the marker is present, then a smaller time window is available to find the vertical force that the CIV exerts. The average of the vertical force in this time window is taken to make the best estimate of force exerted on the pad. If no marker exists, then the value of force used is the average of vertical force once the CIV starts rolling. During traction tests, the value of force used is the average of vertical force while the tires are spinning. (This can be seen on a plot of horizontal force taken from the CIV output data.) These averages are the best guess of the normal force. From the data collected in these tests, there was no way to know the exact amount of vertical force exerted on the soil the moment the tire crossed over the pad. The data from Tactilus® and the pressure pads was not synched with the data from the CIV. The weight on the right front tire using the method described above in each test is given in Table 5.
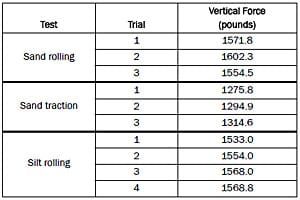
Table 5. Vertical force exerted by the CIV right front tire.
9 Comparing CIV Testing Results with Predicted Values
When comparing values from the Froehlich equation to experimental values from the pressure pads, the Froehlich value changes slightly with exerted vertical force as explained in the previous section. However, each test yielded a different value for the pressure pads. In computing the Froehlich value, a contact area of 50.3 in.2 (Coutermarsh 2008) was used. Assuming circular contact area, a radius of 4 in. was used to find the Froehlich value (Equation 4). Again, a concentration factor of 4 for normal soil was used. When finding the pressure directly below the center of the tire, the same ellipse drawing tool/method as described in the MDT section was used in Tactilus®. This time, the average pressure used is from an area of 13.76 in.2 near the center. The comparison of the equation and experimental values with their corresponding percent errors is presented in Table 6.
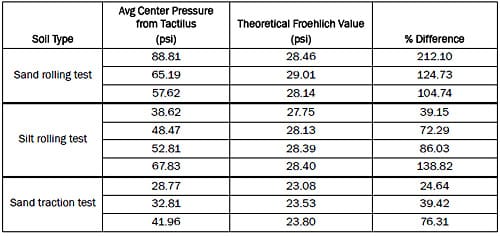
Table 6. Comparison between CIV Froehlich and experimental values.
An analysis of average experimental values is shown in Table 7.

Table 7. Comparison of average Froehlich values with average experimental values.
During the traction tests, the wheels are spinning faster than the vehicle is moving. This seemed to lessen the effective weight of the vehicle and imparts a longitudinal force on the soil. This longitudinal force creates an additional vertical stress in the soil. The average longitudinal force on the tire during the three traction tests was 600 pounds. Using a figure that correlates soil stress to applied stress as a function of depth, the vertical stress was found to be 3.58 psi. This pressure should be added to the calculated Froehlich and LEAF values for the traction test for more accurate results.
10 LEAF Analysis
LEAF is a computer program for layered elastic analysis (Hayhoe 2002). It computes stress, strain, and displacement in three directions. When used in conjunction with pressure pads, however, it is used simply to calculate vertical stresses at precise depths in the soil for comparison with the data from the pressure pads.
LEAF assumes that the load on the surface of the soil is uniform and circular. It computes stress at a point as a function of tire radius, tire pressure, coordinates of the evaluation point, and properties of the soil layers. They are shown in the following formula:

where
a = tire radius;
r = evaluation point radius;
z = depth from top layer;
q = tire pressure;
a = Hankel domain variable.
In calculating the pressure at depth under the MDT tires, a weight of 4700 pounds and an area of 77.5 in.2 was used. The weight was found by weighing the measured tire on a scale in the same testing conditions. The area used is the factory-specified surface area of the tire. The silt and sand samples were both estimated to be 23.7-in. thick over a base of much harder soil. The pressures calculated for 5 in. of sand are within nine percent of the actual pressures felt by the pressure pads with one exception (Table 6). The LEAF values for 2 in. of sand are not as accurate, with a percent difference of about 12% lower than the actual value. This may be a result of the unevenness of the sand as the MDT made progressive passes over it. The LEAF results were much higher than the measured pressures for the silt test, with an average percent difference of 18 percent (Table 8).
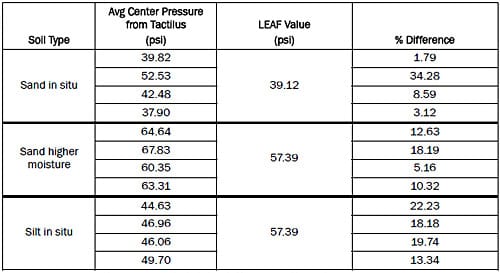
Table 8. Comparison of LEAF values with average experimental values.
11 Recommendations
Based on the findings above, the following are recommended areas of follow-on research or recommendations for the pressure pad program:
- Recalibrate and test the equipment to a baseline before initiating the experimental testing portion. Make sure that the equipment is reliable with a vehicle of known weight.
- Smooth the test section as much as possible to reduce bouncing of vehicles. This allows for better prediction of vertical force exerted on the test section above the area of interest.
- Synch data between the test vehicles and the computer, taking the data from the pressure pads.
- Find more accurate measurements for soil/tire contact areas. Using hard surface contact areas may not provide good estimations for true contact areas. In a softer soil, more of the tire will be in contact with the ground and the contact area increases. An entire study may need to be done to determine how effective area is changed based on contact the tire has in between its treads and/or lugs.
- Determine the effect compaction has on subsequent tests on the same area. Effective depth of the pads will change and predicted values from the Froehlich equation will change.
12 Summary and Conclusions
The goal of this study is to determine the effectiveness of pressure pads originally designed for ergonomics in displaying real data for vertical pressure distribution when buried in soil. Equations such as Froehlich�s modification to the original Boussinesq equation are nice in theory, but there are many variables that exist in the field that the equations do not take into account. However, the comparisons of the Froehlich values and the experimental values for the MDT show that the values are not that different. The pad manufacturer publishes that the pads display data to a 10% resolution. The percent error on the average data for both days of sand testing is less than 10% (4.63 and 7.68, respectively). However, the 20% error for the silt testing can probably be attributed to the simplicity of the Froehlich equation. Silt has many different properties from sand, such as much higher cohesion. However, the Froehlich equation expects the same stress as a given depth as long as the soil is considered to be �normal� (a concentration factor of 4). Although the Froehlich equation assumes a circular contact patch, it seems that it may be a quick and simple way to estimate what stress values to expect at depth. However, the comparison of the CIV experimental and theoretical shows much higher error. It should be noted that the CIV trafficked the test area after the MDT, which left the test area significantly less uniform. The CIV also has shocks, which will cause the load cells on the wheels of the CIV to have oscillating readings, as seen in Figure 2. The contact area given (50.3 in.2) may be incorrect, as this value was obtained from a previous study in which highway tread tires were used as opposed to the all-terrain tread currently on the vehicle. If the pressure pads are functioning correctly, they provide great data for what the pressure distribution of a certain soil looks like. Stress calculated from an equation is probably not as good as the experimental data taken from a reliable device. However, the pressure pads seem to be fickle in their functionality. It may be a better idea to conduct field measurements with a more reliable device or to wait for a second generation of improved pressure pads to be produced.
REFERENCES
- Coutermarsh, B. A. 2008. Personal communication. Hanover, NH: U.S. Army Engineer Research and Development Center, Cold Regions Research and Engineering Laboratory.
- CSI. nd. Product function and technical specification for the IVMMD MK2 system. Dallas, TX: Critical Solutions International Inc.
- Gill, W. R. 1967. Soil dynamics in tillage and traction. Agriculture Handbook No. 316. Washington, DC: Agricultural Research Service, United States Department of Agriculture.
- Hayhoe, G. F. 2002. LEAF�a new layered elastic computational program for FAA pavement design and evaluation procedures. In Proceedings 2002 Federal Aviation Administration Airport Technology Transfer Conference, May 2002. Atlantic City, NJ: Airport Technology Research and Development Branch, Federal Aviation Administration.
- Sharifat, K., and R. L. Kushwaha. 2000. Modeling soil movement by tillage tools. Saskatoon, Saskatchewan Canada: Department of Agricultural and Bioresource Engineering, University of Saskatchewan.
- Smith, R., A. Ellies, and R. Horn. 2000. Modified Boussinesq’s equations for nonuniform tire loading. Journal of Terramechanics 37(4):207�222.
- Soehne, W. 1958. Fundamentals of pressure distribution and soil compaction under tractor tires. Agricultural Engineering 39:276�281, 290, illustrations.
- U.S. Army. 2007. Operator and field maintenance manual including repair parts and special tools list (RPSTL) for mine detonation trailer (MDT) set MK II. Army TM9-2330-338-13&P, Final Draft Equipment Publication (FDEP). Washington, DC: Headquarters, Department of the Army.
Appendix A: Soil Characteristics

Table A1. Soil characteristics for dry sand, wet sand, and silt.
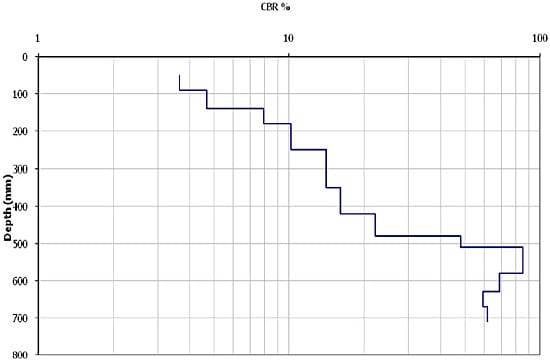
Figure A1. DCP results for dry sand taken on 27 May 2008.
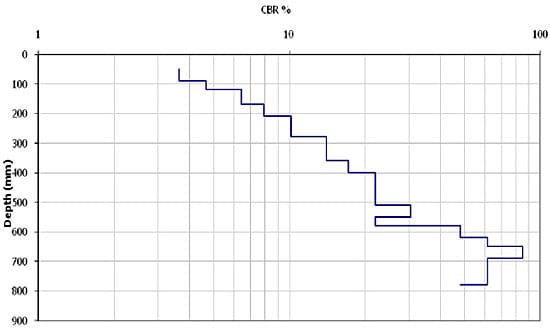
Figure A2. DCP results for higher moisture content sand taken on 29 May 2008.
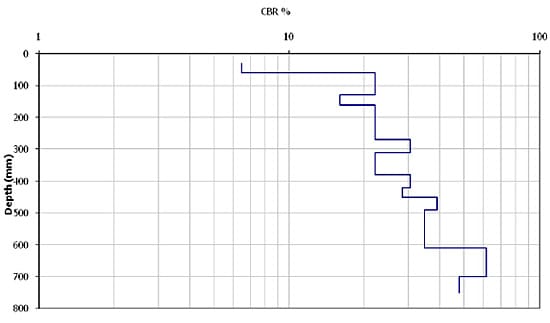
Figure A3. DCP results for silt taken on 2 June 2008.
Appendix B: Tactilus® Screen Shots
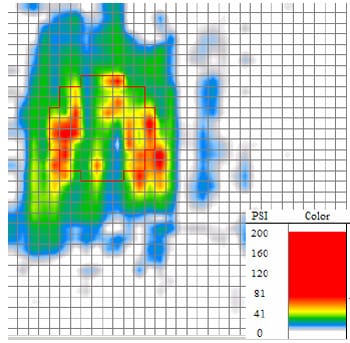
Figure B1. MDT on dry sand, first pass.

Figure B2. MDT on higher moisture content sand, first pass.
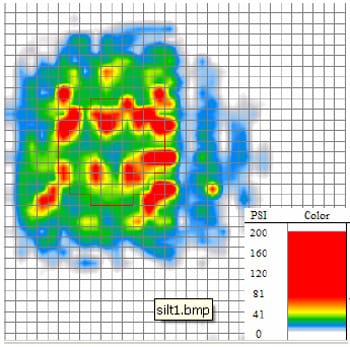
Figure B3. MDT on silt, first pass.
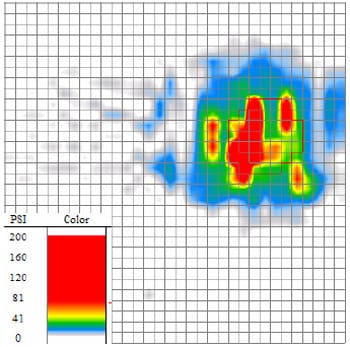
Figure B4. CIV on sand, second pass.
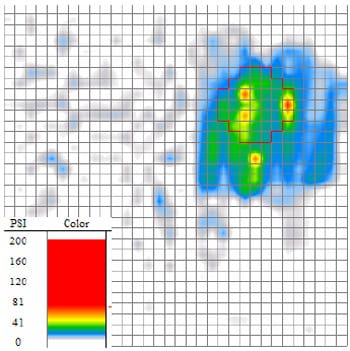
Figure B5. Traction test on sand, second pass.
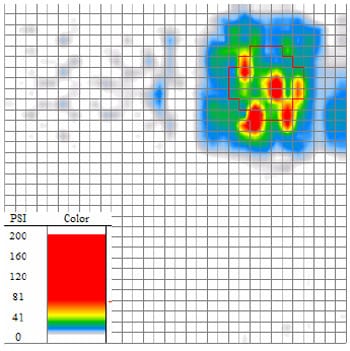
Figure B6. CIV on silt, first pass.
Appendix C: Test Section and Procedure Illustrations
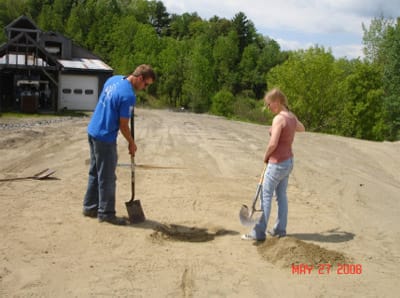
Figure C1. Test section, 27 May 2008.
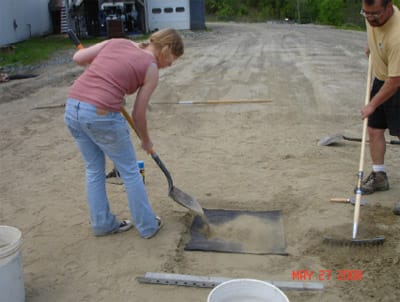
Figure C2. Placement of sifted sand over pressure pad, 27 May 2008.
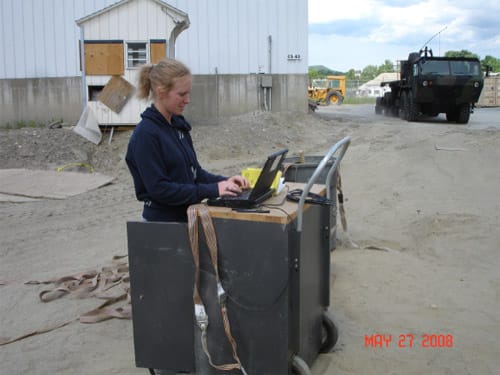
Figure C3. Both buried pads connected to laptop. HEMMT and MDT in upper right, 27 May 2008.
Report Documentation Page
Standard Form 298 (Rev. 8-98)
Prescribed by ANSI Std. 239.18


