Elzbieta Maklewska, Research Engineer, Clothing Research Department, Institute of Knitting Techniques and Technologies TRICOTEXTIL
Prof. Izabella Krucinska, Head of Department Textile Metrology, Dean of Engineering and Textile Marketing Faculty ,Technical University of Lódz, Poland;
Gerard E. Mayers and Bill Ebner, Senior Technical Information Specialists, Sensor Products Inc.
Introduction
To meet current European standards for impact protection clothing and equipment, rigorous testing of shock absorbing materials is essential.¹ A rubberized coir mat, used to absorb or dampen the effect of impact stresses in “traumatic” sports activities like hockey, horse riding, football, “extreme” sports, motorcycling and martial arts, is one such type of material. Successful coir mat design and manufacture relies on accurately assessing both the kinetic energy of impact force and each mat’s cushioning properties. In recent years, a valuable tool known as a test stand has been widely used as part of a two-stage process to measure the kinetic energy of impact force on protective materials. (A detailed description of the test stand and its operation can be found in Maklewska et al.²) In stage one, a test stand records the force of a free-falling impactor of known mass and dimensions dropping onto a rubberized coir mat on a stationary anvil (Figure 1). (The mat approximates parts of the human body where protective gear would be placed or worn.) In stage two, a tactile pressure sensor film is then employed to confirm the impact force effects.
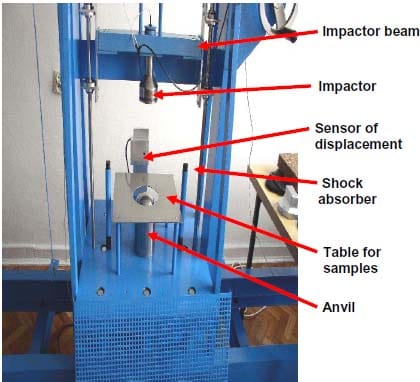
Figure 1 – Test stand used the in measuring of kinetic energy exerted on protective mats. (Courtesy E. Maklewska)
Stage 1 – Testing Physical Impact
During sample testing, impacts are created by the action of impactor acceleration (via a device mounted on the top of the accelerator) and deflection (measured by a laser gauge) on a stationary anvil. By using the equation F = ma where m equals impactor mass, and a equals deceleration (negative acceleration) of the impactor, we can establish the Fmax (force response) for each of the samples.
Software that applies the equation outlined above analyzes the data obtained by the stand to produce an overall report of impact forces. This report specifically highlights the force response (expressed in kN) and the energy absorption (given as EA) on the samples. (See Table 1.)
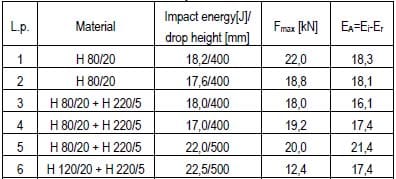
Table 1: Results of TPSF impact tests
Stage 2 — Verifying Impact Accuracy
Upon conclusion of kinetic impact force testing with the stand, the data from each test is verified to both ensure accuracy and to help better understand the forces and total dynamic characteristic (cushioning properties) involved. Since the stand cannot quantify the impact forces transmitted through the shock absorbing materials, we used a commercially available tactile pressure sensor film (TPSF) to quantify and verify our results. TPSF can determine force distribution and magnitude to an accuracy of ±4%.³
TPSF technology is non-destructive, extremely efficient, and easily calibrated. A single-use system, TPSF produces a snapshot of maximal force loading at a specific moment in time, revealing a high-resolution image of how force is distributed across an entire surface. Ranging in thickness from 0.1016 mm to 0.2032 mm, these ultra-thin sheets are structurally affixed to a stiff Mylar substrate that is also pliable enough to allow the film to adapt to intricate or curvaceous surfaces. TPSF types are divided among seven specific quantification parameters, between 2 to 3,037 kg/cm², to maximize pressure measuring data accuracy.
Activation of TPSF is triggered by impact force causing microcapsules embedded in the film to rupture at specific levels. This produces a visible and quantifiable color change. Instantaneous and permanent, this color change is directly proportional to the amount of pressure applied. A spatial resolution of .005 to .015 mm yields an ultra-high definition of force profile imagery, allowing for both immediate visual examination and optical imaging analysis. One such optical image analysis system consists of Windows-based software and a specifically calibrated scanner that reads and interprets the TPSF.4 Images rendered by this system are accurate to ±2 % – ±3 % full-scale (kg/cm2); interpreted images are accompanied by a wealth of graphical and statistical data about the contact pressure test. Analysis of the entire interfacial surface is not only possible, but small and problematic areas can also be enlarged and enhanced for careful scrutiny.
We conducted six experiments, affixing TPSF under each test sample to the anvil. As Table 1 reveals, the thinner the coir mat, the greater the overall impact force distribution. As shown in Fig. 2, the anvil’s shape, thickness of the test material, and the amount of impactor force directly influenced how pressure was distributed.
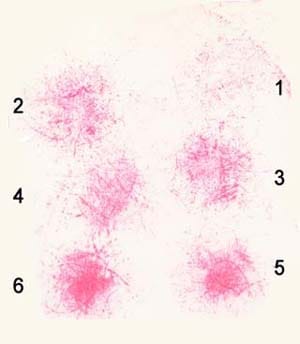
Figure 2 – The results of the six experimental tests of the coir mats are shown in raw form at left. (Courtesy Sensor Products Inc.)
In Table 1, we see that Fmax (kN) equals force response of the sample and EA equals energy absorption. Rubberized coir mats (coir/latex 50%/50%) were the samples used. In the “Material” column we see H 80/20 (mat with density 80 kg/m3, thickness 20mm); H 120/20+H220/5 (two layers of mats: first mat with density 120 kg/m³, thickness 20mm; second mat with density 22 kg/m³, thickness 5mm). The Fmax (kN) figure in the table represents the impact from the drop test with TPSF High (pressure range 500 – 1,300 kg/cm²) film.
Figure 3 shows impact force correlation to energy absorption in line graph form. The raw test data indicates text number 1 has the highest impact force with a corresponding energy absorption value. But according to the line graph, test number 5 indicates the next highest impact force. In addition, test number 5 also has the highest energy absorption value. Visual inspection of the raw test data might, on the other hand, lead one to believe test number 2 gave the next highest yield rather than test number 5. This proves two major points: Impact forces need to correspond to energy absorption and visual inspection may not always reveal accurate information.
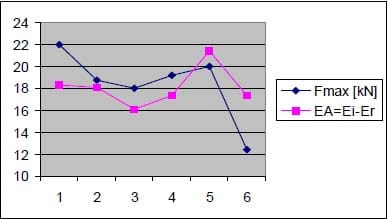
Figure 3 – Graph of coir mats test results. (Courtesy E. Maklewska)
Optical imaging and analysis of the recorded test data clearly shows areas of highest impact pressure. A pseudo-coloring of the digitized test samples reveals, via a yellow-orange area, where impact force energy was greatest (Fig. 4). A histogram chart as well as 2-D or 3-D rendering options (Fig. 5), pressure statistics and pressure profile linescan (a narrow “slice” is quantifiably analyzed to provide even more informa-tion) are some of the other features possible. The optical analysis verified both the acceleration and force response of the impactor element of the stand and also supported the overall results of the experiments.
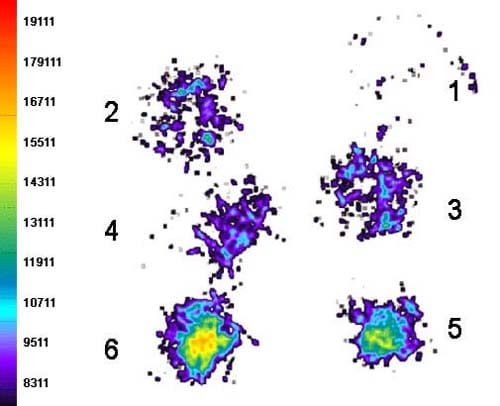
Figure 4 – Pseudo-coloring of the impact snapshotsfrom the TPSF tests shows areas of highest pressure distribution. (Courtesy Sensor Products Inc.)
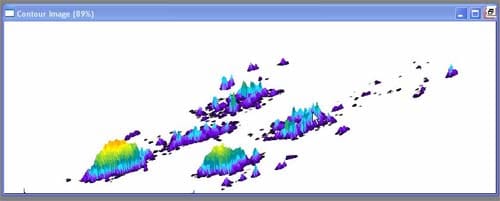
Figure 5 – Shown above is a 3-D representation of impact pressure distribution recorded by a TPSF test of rubberized coir mats on the test stand illustrated in Figure 1. (Courtesy Sensor Products Inc.)
Conclusion
Quantitative examination of impact force energies can help evaluate absorption deflection (cushioning properties) of protective materials. A two-stage test incorporating a mechanical test stand (measuring both kinetic energy of impact force and total dynamic characteristic) and verification through TPSF technology (data collection and analysis of optimal surface force distribution) is a competent methodology.
TPSF technology allows for instantaneous visual review of impact force and average kg/cm2 of kinetic impact force energies. Together with its post-process optical image analysis system, TPSF can validate contact pressure distribution and magnitude testing for not only R&D facilities but also for manufacturers of protective clothing and equipment. Finally, using the TPSF technique offers a statistical means of complying with standards specifically concerned with impact protection clothing and equipment.
REFERENCES
- EN 1621-1: 1997 Motorcyclists’ protective clothing against mechanical impact – Part 1: Requirements and test methods for impact protectors; EN 13158:2000 Protective clothing — Protective jackets, body, shoulder protectors for horse riders (Requirements and test methods).
- Maklewska, E.; Tarnowski W.; Krucinska, I.; New Measuring Stand for Estimation of the Damping Ability of Materials Destined for Manufacture Protective Clothing Used Against Impact Stroke Effects, Fibers and Textiles in Eastern Europe, Volume 12, No. 3 (47) 2004.
- The TPSF mentioned in this paper is specifically known as Pressurex® and is a registered trademark of Sensor Products Inc., East Hanover, New Jersey U.S.A.; www.sensorprod.com/pressurex. For more information, please contact 1.973.884.1755 or email [email protected].
- The optical image analysis system also mentioned in this presentation is known as Topaq® and is a registered trademark of Sensor Products Inc., East Hanover, New Jersey U.S.A.; www.sensorprod.com/topaq. For more information, please contact 1.973.884.1755 or email [email protected].
Note: Elzbieta Maklewska is a research engineer at the Institute of Knitting Materials in Lodz, Poland; Prof. Izabella Krucinska is the Head of Department Textile Metrology, Dean of Engineering and Textile Marketing Faculty of Technical University of Lódz, Poland; Gerard E. Mayers and Bill Ebner are both senior technical information specialists at Sensor Products Inc. in East Hanover, NJ (USA).


