by A.B. Liggins, W.R. Hardie and J.B. Finlay
Abstract
Due to its ease of application, Fuji prescale pressure-sensitive film is currently one of the more popular methods, within the biomechanics community, for assessing contact areas and pressures within articulating jOints-in addition to its use in industry. This material produces a stain on the application of pressure due to the rupture of microscopic bubbles releasing a liquid which, in turn, causes patches of color to be formed; a greater pressure produces a darker stain. These stains are often converted into digital images and manipulated to produce false-color pressuremaps, an approach which is beyond the simple methods of analysis suggested by the manufacturer. Due to the granular nature of Fuji film stains, the two user-defined variables which will determine the accuracy of any pressure-map are: (a) the size of the sample-area used to capture data from the original stain during the digitization process and (b) the number of pressure-intervals identified on each map; the chosen values should match the spatial and pressure resolutions of the film. Despite the importance of these factors, the literature presents a bewildering array of values, particularly for the number of pressure-intervals, with no validation of those chosen; consequently, little guidance is provided for other potential users of Fuji film. This paper discusses the relationship between sample-area and pressure- interval and introduces a method for examining their effect on the resulting pressure-maps. The results obtained using ‘Super Low’ grade Fuji film suggest that the authors of some previously reported methods may have been overambitious in their choice of sample-area and pressure-intervals. Finally, a series of suggested values of sample-area size and pressure-intervals are provided.
Introduction
A knowledge of the contact areas and pressures which are produced between the bearing surfaces of any animal joint will give an indication of the function of that joint. Consequently, there has been much interest in the development of methods for recording these properties, with a view to assessing the biomechanics of the normal, pathological or prosthetic joint. Contact areas can be recorded using simple ink-impression1,2 or joint-casting1-3 techniques; however, the problem of recording interface pressures within a joint has required more sophisticated approaches. One solution to this problem has been to develop custom-made discrete pressure transducers which are embedded in, or under, one of the articulating surfaces4,5 and give an electrical response with pressure. These transducers have the advantage of producing real-time data which can be easily interpreted; however, they only provide data from discrete positions on the articulating surface and may miss areas of high pressure or high pressure-gradients. In addition, such devices may require careful preparation of the joint for transducer implantation, including disruption to one of the articular surfaces.4,5
Fuji film is currently supplied in five grades (ultra-superlow, super-low, low, medium and high) which together allow pressures between 0.2 and 130 MPa to be recorded. With the exception of high-grade film, this material consists of two sheets (the A- and C-films), both having an active layer on one of their surfaces; on the high-grade film, these layers are currently over-laid on a single sheet. The film produces a pressure-dependent response by utilizing a layer of microscopic bubbles (approximately 2-25 ILm in diameter) on the A-film25 which burst on the application of pressure. The clear liquid subsequently released from the burst bubbles passes onto the active layer of the C-film, and reacts to produce a pink stain. Below the lower pressure- threshold for each film-grade, no stain is produced; above the upper pressure-threshold, the stain becomes saturated.
In addition to pressure, the film’s response is affected by load-rate, ambient temperature and relative humidity. Therefore, the manufacturer supplies two calibration charts for each film-grade, allowing for two load-rates. The color of any test stain is compared to a series of eight color samples, either visually or using the optional densitometer (artic1e# FPD 301), which allows 2-mm-diameter sample-areas to be assessed. The color samples correspond to density values on the y axis of the calibration chart; pressure is read off the x axis via one of four calibration curves which allow compensation for ambient temperature and humidity conditions. The use of the densitometer and calibration charts has been described previously.5 however, this approach contains a number of apparent limitations which restrict its use. Firstly, the spatial resolution is limited to a 2-mmdiameter, which is the detection area for the densitometer; the pressure resolution is similarly limited, since only eight color samples are provided. Calibration curves are only provided for the application of ‘momentary pressure’ (pressure applied for five seconds and maintained for an additional five seconds) or ‘continuous pressure’ (pressure raised ‘gradually’ for two minutes and then maintained for an additional two minutes), thereby limiting any test procedures to these loading regimes, which may not be convenient for any particular test. Finally, although the original stain gives a full-field recording of interface pressures, use of the densitometer makes the production of accurate pressure-maps difficult and time-consuming.
These limitations have led to the development of digital techniques for the calibration of Fuji film and the presentation of full-field pressure data.1,13,14,17,19-22,24,25 The film is calibrated using a series of stains produced at known pressures across the working range of the film-grade being used. These stains are then digitized using either a video camera1,20,24,25 or scanning device;17,19,22 the subsequent optical- density versus applied-pressure data are used to produce a polynomial expression relating these two factors. Consequently, any stains taken from an interface of interest can be converted into full-field pressure-maps by applying the calibration expression to all points on that stain.
Digital methods have the potential for analyzing the output from Fuji film using smaller sample-areas and pressureincrements (i.e., with increased spatial and pressure resolutions) than with the manufacturer’s suggested method. Improved spatial and pressure resolutions would benefit the analysis of stains taken from small areas or those containing notable pressure-gradients; however, there has been no published consensus as to the valid pressure and spatial increments to be used in conjunction with digital analysis of Fuji film. Quoted pressure resolutions range from four15 to twenty25 increments across the valid film range. Hehne et al.20 quoted a spatial resolution of 0.5 mm, which is consistent with our qualitative observations.25 Surprisingly, while the techniques presented in the literature have the potential for producing accurate quantitative pressure data, a quantitative validation of spatial and pressure resolution to support the quoted values has not been presented.
In our previously described method for calibrating Fuji film,1,25 standard 25.4-mm-diameter calibration stains are obtained for twelve pressures across the working range of the film-grade being calibrated; these stains are produced using a finely ground punch and base-plate assembly. Each stain represents the film’s response to an evenly distributed pressure; however such stains have been observed to be granular in appearance, consisting of discrete patches of color, due to the distribution of the bubbles on the A-film.22 These color patches are of varied size and color intensity over a single stain and, at pressures towards the lower threshold of the film, they may not have a sufficient distribution to provide full coverage of the film substrate. Consequently, each value of applied pressure is represented by a range, rather than one discrete value, of optical density.
Fuji film stains are converted into digital images via a CCD video camera and a personal computer (PC) running ImagePro Plus image-processing software (Media Cybernetics, Silver Spring, MD 20910, USA). On these digital images, optical densities are represented by pixels exhibiting a range of values between 0 (representing ‘black’) and 255 (representing ‘white’); due to the properties of the CCD camera and the imaging board within the PC, the scale of these images is such that 10 mm is represented by 100 pixels on the x axis and by 125 pixels on the y axis. A 289- mm2 box within the boundaries of any given calibration stain is designated as the ‘area of interest’ (AOI). Using the AOI-analysis facility of ImagePro Plus, the values of the individual pixels within this area have been observed to produce a frequency histogram which, typically, approximates a normal distribution. Therefore, pixel-value data can be used to provide a mean and standard deviation for each calibration stain; the mean values can then be used to produce a fifth-order calibration curve,25 thereby providing a relationship between pixel-value and pressure. A fifth order polynomial regression through the data was chosen since the subsequent equations were qualitatively observed to produce the best possible fit.
Objective
The objective of this work was to use the existing digitization equipment, in conjunction with additional customwritten software, to produce a detailed quantitative assessment of the spatial and pressure resolutions of Fuji film. The subsequent data would provide a hitherto unavailable guide to practical values for these factors, which would be of use in both industrial and biomechanical settings.
Theory
Our normal method for analyzing stains taken from a test interface has been to scan the resulting stain image pixel-by- pixel,1,25 which represents the highest possible spatial resolution for a digital image and is consistent with previously reported methods;10,14,17.19,22,24,26 the pressure at each pixel is calculated from the previously determined calibration curve and the pixel replaced with a grey-scale value or color corresponding to a predetermined (arbitrary) pressure- interval within which the calculated pressure lies. In this way a full-field pressure-map can be produced using a limited number of easily-identifiable shades or colors. This approach, however, may be inappropriate due to the granular nature of the film’s stain response.
The distribution of pixel-values across a stain image which has been taken from an area of even pressure, P, (eg. a calibration stain) can be represented by a mean pixel-value, M, and the associated upper and lower boundaries Bu and BL , respectively. If the boundaries are given by the mean plus or minus twice the standard deviation, then (due to the observed normal distribution of data) the resultant range of values will represent 95 percent of the data, thereby excluding extraneous outlying values. Figure l(a) shows a graphical representation of a section from a typical fifthorder polynomial calibration curve, to which the stain-image data corresponds. Using this curve, the mean, M, will return a pressure value P’, close to P; the correlation of P’ to P will depend on the correlation coefficient of the fifthorder polynomial regression to the calibration data. The boundaries, Bu and BL , will return pressure values PL and Pu, respectively. From this analysis, it can be seen that a significant number of the pixels on the stain will return apparent pressure values across a range, R, between PL and Pu; this phenomenon will affect the determination of pressure resolution as follows.
Fig. 1 – The translation from pixel value to pressure data. (a) The range of values from a single stain. (b) The relationship between pressure range and pressure interval
In Fig. 1(b), AI1 and AI2 represent similar, adjacent, arbitrary pressure-intervals which are used to assign the individual pressure-values calculated from the calibration relationship into discrete bands of pressure, as described above. If a stain, taken under even loading conditions, returns a mean pressure of P1 with range R1 such that R1 is completely enclosed by AI1 then a significant number of the pixels within the stain will be subsequently replaced by a value corresponding to AI1 Since P1 lies within AI1 this represents a correct interpretation of the data from the stain. If a second stain returns a mean pressure value of P2 with range R2, such that P2 is close to the border between All and AI2 , then a number of the pixels within this stain will be incorrectly replaced by a value corresponding to AI2.
From this observation, an error interval, EI, can be defined such that any stains returning mean pressure values which fall within EI will have associated pressure ranges which cross the boundary between AI1 and AI2. This condition will apply at the borders between all pressure-intervals across the total range of the film. Therefore, to reduce errors when calculating pressures from within an interface which displays an uneven pressure distribution, EI should be small with respect to the arbitrary pressure-interval. This requirement can be achieved by increasing the size of the pressure-intervals or by reducing the spread of pixel-values about the mean for any stain-area taken at a constant pressure.
In practice, this approach could easily lead to pressure intervals which represent a significant proportion of the overall pressure range for the film and hence greatly limit the pressure resolution. A practical compromise is first to define the pressure range using the mean pixel-value plusand- minus one standard deviation; although this approach only represents 67 percent of the data points; this is the generally accepted limit for statistical analysis. Similarly, the valid pressure intervals can be defined as being equal to the pressure range associated with a stain for a pressure at the midpoint of any given interval. Here, the error associated with pressure ranges which straddle pressure inte
rvals is regarded as acceptable, since the majority of the range will lie within the correct interval. A pressure consistent with a boundary between intervals will produce a stain in which the calculated pressure range will fall approximately equally between intervals; this phenomenon will have the effect of ‘blurring’ the transition between intervals on a full-field pressure map. Using this method, the number of pressure intervals will be directly related to the range, R, of pixel-values associated with a stain taken at a constant pressure; a decrease in the value of R will result in an increase in the number of pressure intervals.
Since the techniques outlined above are affected by the range of pixel-values produced by a single pressure, it is appropriate to examine the relationship between this factor and sample-area size. In Fig. 2(a), boxes I, 2 and 3 represent sample areas, each consisting of one pixel, as described above. Boxes 4 and 5 represent the boundaries of larger sample areas containing a number of pixels (in this example each area is 4 pixels x 4 pixels square). To transform the original stain image shown in Fig. 2(a) into one consisting of larger (single-pixel-value) sample areas, the mean value for pixels within the boundaries of each of these areas is first calculated; each pixel on the original stain image is then rewritten to the mean value of the sample area within which it lies. This process results in an image such as that shown in Fig. 2(b). Since each sample area originally contained a range of pixel values, the subsequent mean values used tO rewrite these areas will constitute a smaller range of data about the overall mean value for the slain; thus, the error interval wilt be reduced and the pressure resolution increased, at the cost of reduced spatial resolution.
From the previous discussion, it can be seen that spatial and pressure resolution are inversely related.
Fig. 2 – The relationship between sample-area size and mean pixel value. (a) 1 x 1 pixel sample areas. (b) 4 x 4 pixel sample areas
Materials and Methods
Thirty-six 30-mm-square pieces of both A- and C-film were CUI from a sheet of superlow Fuji film (this film has a range of 0.5 to 2.5 MPa). Using this material, standard 25.4-mm-diameter calibration stains25 were produced at 12 pressures between 0.26 and 2.97 MPa; these pressure boundaries allowed an extension rela tive to the film ‘s valid range in order to produce an accurate fifth -order curve-fit with in that range.25 An MTS 858 Bionix universal testing maehinc (MTS Systems Corporation. Eden Prairie, MN 55344-2290, USA) was used to apply loads 10 the film; the loading procedure was controlled by an MTS 410.8 function -generator to produce a one-minute linear ramp up to maximum load (±0.1 linearity), one-minute hold at maximum load (± I N, i.e ., ± 2 kPa applied pressure), followed by a one-minute linear ramp down to an initial preload of 10 N. Immcdiately following the product ion of these stains. groups of six ‘test’ calibration stains were produced at each of four nominal pressures (0 .5, 1.0, 1,77 and 2.5 MPa), using the same loading protocol as before. Following a ‘development period’ of 50 hours, 25 each stain was digitized as described above. The images of the 12 standard calibration stains provided data which were used to produce a fifth -order relat ionship between applied pressure and mean pixel-value using SigmaPI()( software (Jandel Scientific. Corte Madera, CA 94925, USA).
ImagePro Plus has the facility to use ‘script-files’ to conduct a sequence of commands automatically; these files consist of ASCII (American Standard Code for Information Interchange) text and are normally produced by recording the desired sequence of events as they are conducted by the operator. Due to the large number (up to 36, 100) of commands required by our protocol for Fuji film analysis, a computer program was custom- written in the ‘C’ programming language to generate the necessary script-files. Fuji film images were subsequently analyzed as follows.
A 190-pixel-square area was defined within the stain, consistent with the AOI used in the calibration procedure .25 An AOI corresponding to each of the sample-areas shown in Table 1 was advanced across the 190-pixel-square area in I-pixel increments along both the x and y axes, such that the AOI was placed at every possible position within the larger area. It should be noted that the height of each AOI represents the closest approx imation to the associated width (the ideal AOI being square), given the limitation of the digitization procedure and a 125 percent venical aspect ratio. At each position, the AOI was analyzed to produce a mean pixel value, which for clarity will be referred to as thc ‘sample pixel value.’ This procedure was repeated for all sizes of AOI shown in Table 1. For each stain, a separate custom-wrillen computer program was used to calculate the mean and standard deviation of the individual sample pixel values for each size of AOI.
At each nominal pressure, the mean values for each stain wcre used to calculate both an overall mean, Mo, and the coefficient of variation (COV); the latter was used to assess stain repeatability. Since all the sample pixel values for all six stains represent data from the same popu lation, the standard- deviation data from each stain wcre combined (using the method of ‘pooled variance’) to give an overall standard deviation of the population, Sp, for each sample size. The values of Mo and Sp for each nominal pressure and sample size were transferred to SigmaPlot and used to calculate mean pressure and range values from the previously determined calibration relationship.
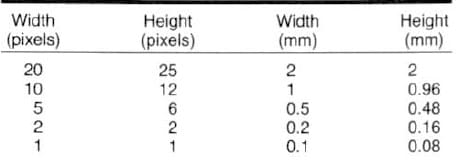
TABLE 1 – SAMPLE AREAS USED TO ANALYZE FUJI FILM STAINS
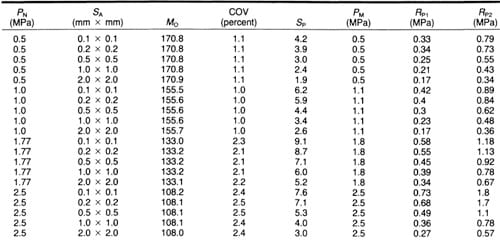
TABLE 2 – RESULTS OF FUJI FILM ANALYSIS

TABLE 3 – SUGGESTED PRESSURE INTERVALS FOR ‘SUPER LOW’ FUJI FILM
Results
Table 2 shows the overall mean pixel value (Mo) the coefficient of variation of the individual means (COV), the overall standard deviation for the population (Sp), the ‘mean’ pressure (PM) calculated from Mo and the pressure ranges calculated from both Mo ± Sp (Rp1) and Mo ± 2Sp(RP2 for each sample-area size (SA) and nominal pressure (PN).
Discussion
The results from this experiment show that sample area size has a minimal effect (2 percent) on the overall mean pixel value, Mo, obtained from any group of stains, as would be expected; in addition, the COV’s of the individual mean pixel values within any group indicate a high degree of repeatability. As predicted, the overall standard deviation, Sp, for a population of six stains decreased with increasing sample-area size. Translating these data into pressure ranges, it is obvious that those calculated on the basis of Mo ± 2Sp are unduly large for practical use. The pressure ranges based on Mo ± Sp can be used to produce the suggested practical pressure intervals shown in Table 3; these intervals are based directly on the calculated pressure ranges, rather than allowing an error interval, EI, as discussed above, which would be impractical. It is interesting to note that the calculated pressure ranges, Rp1, and hence the suggested pressu
re intervals, increase with increasing interface pressure, as opposed to being uniform, as is normally assumed. This phenomenon is thought to be due to the accumulation of stains from all the bubbles on the A-film which will rupture at all pressures up to that being applied; since bubbles of different sizes will rupture at different pressures, a higher pressure will cause bubbles across a larger size range to burst, producing an overall stain consisting of patches exhibiting a greater number of stain densities (which will be related to the amount of dye in each bubble, and hence bubble size).
Figure 3 shows a typical calibration stain, taken at a nominal pressure of 1 MPa, which has been rendered as a series of false-color pressure-maps using (from Figs. 3(a)( e), respectively) sample areas of 0.1 x 0.08, 0.2 x 0.16, 0.5 x 0.48, 1 x 0.96 and 2 x 2 mm and their corresponding suggested pressure intervals, as given in Table 3; it should be noted that the additional ‘white’ and ‘black’ pressure intervals represent areas below the lower pressure-threshold and above the upper pressure-threshold of the film, respectively. These pressure-maps illustrate a number of trends which are generally observed: it can be seen that increasing the sample-area size results in decreased spatial definition; indeed, Fig. 3(e) (2 X 2 mm sample-area size) presents a somewhat abstract representation of the original circular stain. Another noticeable effect of increasing the sample-area size is that erroneous data are produced at any sharp interfaces between optical densities; this phenomenon can be seen at the stain edges. The compromise of using Mo ± Sp to define the pressure intervals for any size of sample area produces a series of pressure-maps which indicate a spread of pressure values; with the exception of Fig. 3(c), the pressure interval corresponding to the applied pressure (I MPa) covers the greatest area of each map. Due to the reduced number of pressure intervals used to produce maps for the smaller sample areas, the indicated pressures lie across most of the valid range of the film. Increasing the number of pressure intervals will reduce this effect; however, it has been observed that some outlying data will still produce stray pressure values, while the overall result will be a less distinct, and somewhat confusing, distribution of pressures, with the desired pressure interval being less prominent. This phenomenon is illustrated in Fig. 4, which was produced using single-pixel sample-areas (0.1 x 0.08 mm) and the eight pressure ranges of Fig. 3(e).
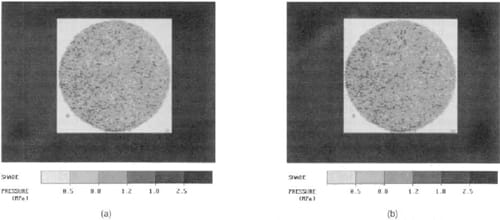
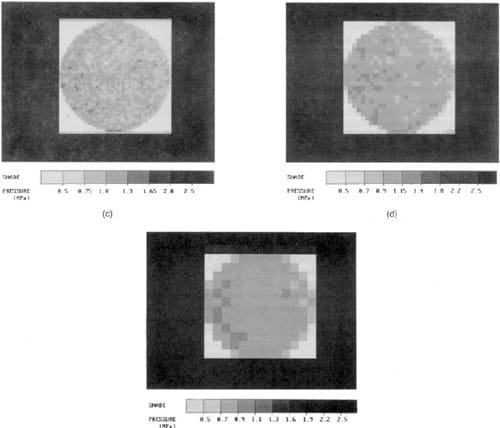
Fig. 3 – Typical pressure maps from a l-MPa calibration stain, rendered with different sample-area sizes (8…) and number of pressure intervals (N). (a) SA = 0.1 x 0.08 mm, N = 4. (b) S,. = 0.2 x 0.16 mm, N = 4. (e) SA = 0.5 x 0.48 mm, N = 6. (d) SA = 1 x 0.96, N = 7. (e) SA = 2 x 2 mm, N = 8
Figure 3(c) illustrates the case when the nominal pressure lies on the boundary of two pressure intervals; this situation results in a spread of indicated pressure values such that the majority of the map indicates one or other of these two intervals.
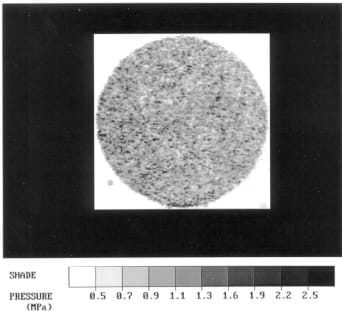
Fig. 4 – Typical pressure map from a 0.1-MPa calibration stain, using eight pressure intervals for a 0.1-mm x 0.08- mm sample area (IE., twice the recommended number of intervals)
Conclusions
It can be seen from the preceding discussion that digitizing the stain output from Fuji pressure-sensitive film and rendering the subsequent data as false-color pressure-maps involves a number of compromises which serve to reduce the overall accuracy of the technique; filtering techniques may alleviate some of the problems inherent with this technique and will be discussed in a future paper. Consequently, it is clear that the authors of some previously reported techniques which used both small sample areas and greater than four pressure intervals may have been overambitious in their selection of these factors.17,24,25 Similarly, the use of large sample areas should be avoided due to the loss of spatial information. Qualitatively, a reasonable compromise for super low Fuji film would appear to use sampleareas in the order of 0.5 x 0.5 mm or 1 x 1 mm with the pressure-intervals suggested in Table 3 above.
As discussed above, Fuji film response has been shown to be dependent on the ambient temperature and humidity at which stains are obtained.1,25 The stains used for these preliminary experiments were obtained at a mean (±SD) temperature of 25.4 ± 0 .20 C and a mean (±SD) relative humidity of 45.3 ± 2.6 percent, which are typical ambient conditions for our laboratory. Further analyses are required to assess the effect of ambient conditions on pressure and spatial resolution; analyses are also required for the other film-grades (ultra-super-Iow, low, medium and high), al though similar characteristics would be expected due to the similar physical characteristics of each film-grade.
References
- Liggins , A.B. and Finlay, 1.B ., “Recording Contact Areas and Pressures in Joint Interfaces,” Experimental Mechanics: Technology Transfer Between High Tech Engineering and Biomechanics, ed. E.G. Little Elsevier Science Publishers, Amsterdam, 71-88 (1992).
- Stormont, T.l .. An, K.N., Morrey, B.F. and Chao, E.Y., “Elbow Joint Contact Study: Comparison of Techniques,” J. Biomech .. 18 (5). 329-336 (1985).
- Simon, W.H., “Scale Effects in Animal Joints,” Arth. Rheu., 13 (3). 244-255 (1970).
- Manouel, M., Pearlman, H.S., BalakhfeJ, A. and Brown. T.D., “A Miniature Piezoelectric Polymer Transducer for in vitro Measurement of Ihe Dynamic Contact Stress Distribution, ” J. Biomech., 25 (6). 627-635 (1992).
- Inaba. M. and Arai, M .. “A Method for Measuring Contact Pressures Instantaneouslv in Articular Joints, ” J. Biomech .. 22 (11), 1293- 1296 (1989).
- Ahmed, A.M. and Burke, D.L. , “In-vitro Measurement of Static Pressure Distribution in Synovial Joints-Part I: Tibial Surface of the Knee,” J. Biomech. Eng .. 105,216-225 (1983).
- Frisina, W. and Lehneis. HR .. “Pressure Mapping: A Preliminary Report.” J . Biomech., 3 (6), 526- 528 (1970).
- Bourgois. R. and Bel, J .. “A New Cheap Pressure Foil, “Strain. 29 (1),27-28 (1993).
- Afoke, N.Y.P., Byers, P.D. and Hulton, W.e., “Contact Pressures in the Human Hip Joim.” 1. Bone and Joim Surg., 698 (4), 536-541 (1987).
- Haut, RC., “Contact Pressures in the Patellofemoral Joint During Impact Loading on the Humnn Flexed Knee,” J. Orthop. Res., 1 (2). 272-280 (1989).
- Fukubayashi, T. and Kurosawa, H., “The Contact Area and Pressure Distribution Pattern oj the Knee: A Study of Normal and Osteoarthrotic Knees, Acta Orthop. Scand .. 51. 871 – 879 (1980).
- Hehne, HI, Ficker, E., Jantz. W., Mahr, D. and Schopf. HJ ., “A New Methodfor Measurements of Pressure Distributions and Contact Areas in Joints,” Morphol. Med., 1. 95-106 (1981).
- Wagner, U.A., Sangeorzan, B.J., Harrington, R.M. and Tencer, A.F., “Contact Characteristics of the Subtalar Joint: Load Distribution Between the Anterior and Posterior Facets,” J. Orthop. Res., 10 (4), 535-543 (1992).
- Werner, F.W., Murphy, D.J. and Palmer, A.K., “Pressures in the Distal Radioulnar Joint: Effect of Surgical Procedures Used for Kienbock’s Disease,” J. Orthop. Res., 7 (3),445-450 (1989).
- Tencer, A.F., Viegas, S.F., Cantrell, J., Chang, M., Clegg, P., Hicks, c., O’Meara, C. and Williamson, J.B., “Pressure D
istribution in the Wrist Joint,” J. Orthop. Res., 6 (4),509-517 (1988). - McNamara, JL, Collier, J.P., Mayor, M.B. and Jensen, R.E.,. “A Comparison of Contact Pressures in Tibial and Patellar Total Knee Components Before and After Service in vivo,” Clin. Orthop., 299, 104-113 (1994).
- Singerman, R.J., Pedersen, D.R. and Brown, T.D., “Quantitation of Pressure-sensitive Film Using Digital Image Scanning,” EXPERIMENTAL MECHANICS, 27 (1), 99-105 (1987).
- Ronsky, J.L., Herzog, W., Brown, T.D. and Leonard, T., “Invivo Determination of Patellofemoral Joint Contact Pressures,” J. Biomech., 26 (3), 352 (1993).
- Brown, T.D., Pope, D.F., Hale, J.E., Buckwater, J.A. and Brand, R.A., “Effects of Osteochondral Defect Size on Cartilage Contact Stress,” J. Orthop. Res., 9 (4),559-567 (1991).
- Hehne, H.J., Haberland, H., Hultzsch, W. and Jantz, W., “Measurements of Two Dimensional Pressure Distributions and Contact Areas of a Joint Using a Pressure Sensitive Foil,” Biomechanics: Principles and Applications, ed. R. Huiskes, DB. Van Campen and J.R. De Wijn Martinus Nijhoff, The Hague, 197-203 (1982).
- Sangeorzan, B.J., Wagner, U.A., Harrington, R.M. and Tencer, A.F., “Contact Characteristics of the Subtalar Joint: The Effect of Talar Neck Misalignment,” J. Orthop. Res., 10 (4), 544-551 (1992).
- Hale, J.E. and Brown, T.D., “Contact Stress Gradient Detection Limits of Pressensor Film,” J. Biomech. Eng., 114 (3),352- 357 (1992).
- Pan, H.Q., Kish, V., Boyd, R.D., Burr, D.B. and Radin, EL, “The Maquet Procedure: Effect of Tibial Shingle Length on Patellofemoral Pressures,” J. Orthop. Res., 11 (2), 199-204 (1993).
- Marder, R.A., Swanson, T.V., Sharkey, N.A. and Duwelius,
P.J., “Effects of Partial Patellectomy and Reattachment of the Patellar Tendon on Patellofemoral Contact Areas and Pressures,” J. Bone and Joint Surg., 75A (1), 35-45 (1993). - Liggins, A.B., Stranart, J.C.E., Finlay, J.B. and Rorabeck, CB., “Calibration and Manipulation of Data from Fuji Pressure sensitive Film,” Experimental Mechanics: Technology Transfer Between High Tech Engineering and Biomechanics, ed. E.G. Little, ELsevier Science Publishers, Amsterdam, 61-70 (1992).
- Caldwell, N.J., Hale, J.E., Rudert, J.M. and Brown, T.D., “An Algorithm for Approximate Crinkle Artifact Compensation in Pressure-sensitive Film Recordings: J. Biomech., 26 (8), 1001-1009 (1993).
- Wonnacott, T.H. and Wonnacott, R.J., Introductory Statistics, 5th Ed., John Wiley and Sons, Toronto, 266 (1990).


