Gwen Ralphs
Thomas R. Lunsford, C.O.
Jack Greenfield, C.O.
Introduction
The conservative management of many common foot disorders involves the prescription of shoe inserts. Boulton 1 showed that neuropathic diabetic patients with a history of foot ulceration have abnormally high pressures, as high as 20-30 kglcm2, under the forefoot during walking. These patients are at risk of recurrent ulceration because of impaired pain and joint position sensation and increased pressures under the metatarsal heads. Broadley2 considers rheumatoid arthritis as a model for hallux valgus, hammer toes, flattening of the longitudinal arch, pronation of the hind foot, metatarsalgia, thinned skin, and thinned subcutaneous tissues. Patil3 studied leprotic feet in Hansen’s disease where loss of sensation and muscle paralysis can lead to physical deformity and irreversible nerve damage. Excessively high pressure on the leprotic foot for prolonged periods causes mechanical damage to skin and soft tissues without the patient’s knowledge. Patil showed that the feet of leprosy patients exhibit pressures two to three times the pressures found under normal feet (9.2- 11.2 kg/cm2).3
these and other types of patients include custom designed shoes and/or inserts. The inserts can be custom molded or soft unmolded insoles made from Plastazote� or Spenco� cut in the shape of the standard sock liner insert. The custom molded inserts generally incorporate force redistributing features. 4,5,6 Attempts to reduce excessive plantar pressure have produced a wide variety of shoe inserts which are placed between the shoe insole and the plantar surface of the foot.
Due to the great number of materials and designs for inserts available, there is a need for a clinical method of determining which patients require orthotic inserts and a reasonably simple and objective method of determining the effectiveness of a given orthosis in reducing pressure. Further, because patients’ feet change as well as their inserts, a simple and objective method is needed to assess insert efficiency after being worn by the patient for a given period of time.
Interest in both a qualitative and quantitative understanding of pressures on the plantar surface of the foot has inspired many insightful techni~ues of measuring the pressures. Beyerlein7 devised an array of rubber pyramids which produced an image that was transmitted to a viewing screen by fiber optics. Guth8 measured pressure distribution from an array of spring loaded pins whose movements were processed by a computer. Stokes9 placed 12 beams on each of two strain gauge force transducers on a platform mounted on a plate in a walkway. HenniglO serially connected capacitance force transducers and light emitting diodes, whose light density depended on the force-dependent impedance of the capacitors. Shipleyll,12 used the “Harris” footprint mat to record plantar pressures. In general, existing methods of measuring pressure are costly, time consuming;, or cannot be performed within the shoe. 13,14,15
C. Itoh & Company (America), Inc. has developed Fuji Prescale Film for direct observation of the pressure distribution between two surfaces (such as the shoe insole and the plantar surface of the foot). The pressure is determined by comparing the shade of red on the film with a color chart calibrated for pressure. One application of pressure to the film will produce the same shade of red as multiple applications. There are four grades of film which allow pressures to be measured from 5-700 kg/cm.2,16 A previous attempt to evaluate Fuji Prescale Film was made by Aritomi, et a1, 7 In this study, subjects being evaluated stood on a mat containing 5/32″ diameter ball bearings under which were placed the prescale film. The developed film was an array of red dots with varying intensity which were transformed into isopressure contours via computer topography. Then the authors attempted to correlate the results of x-ray examinations with the isopressure charts. Although this study confirmed the diagnostic properties of the prescale film with experimental correlations, it did not demonstrate its clinical usefulness. It is the purpose of this study to evaluate the feasibility of using Fuji Prescale Film as a means of clinically assessing plantar pressure in a controlled group of subjects representative of the vast population of patients for whom inserts are prescribed.
Method
Ten patients, eight females and two males, who had complained of foot pain or had calluses on their metatarsal heads were selected as subjects for this study. They ranged in age from 23 to 51 years and in weight from 135 to 215 pounds. The patients were diagnosed as having metatarsalgia or pes cavus, and shoe inserts had been prescribed to relieve their pain. Impressions were taken of the subjects’ feet and the casts were modified by building up the metatarsal head area. Custom cork/ Spenco,� inserts were fabricated by vacuum forming thermo-cork and lining with Spenco� as a sock liner. A second insert, non-molded Plastazote�, was made by cutting pieces of 114″ thick Plastazote� to fit into the patients’ shoes.
Fuji Prescale Film was placed in each patient’s shoe so that it was compressed by the metatarsal heads as the subject walked. The Fuji pressure sensitive film consists of two sheets, a color forming sheet (A-film) and a color reactive sheet (C-film). The C-film is a common grade, having an applicable pressure range of 5-700 kg/cm2, while the A-film is available in four grades: super pressure (70-250 kg/cm2 ; and high pressure (250-700 kg/cm2). Only the super low and low pressure grades were used in this study.
Separate pieces of Fuji A-film and C-film were cut into matching rectangular strips (1 x 3 inches) and joined together by taping all sides (Figure 1). This sandwiching ensured that the appropriate reaction would occur during weight-bearing. The first metatarsal head was palpated and marked on the plantar surface with a circle in order to assure proper placement of the film patch (Figure 2). The rectangular film patch was taped to the subject’s foot to keep it in place (Figure 3). A shoe was placed on the subject’s foot and the subject walked 30 steps without the shoe insert. The first film patch was removed and the shade of red produced was compared to the color-pressure chart and associated pressure recorded. A second patch was applied; the subject walked 30 steps with the Cork/Spenco� insert, then this patch was removed and read. Finally, a third film patch was applied; the subject walked 30 steps with the 114″ thick Plastazote� insert; and this p
atch was removed and read. All subjects wore athletic shoes. In each trial, the film pressure reading was taken 20 minutes after exposure as indicated in the instruction manual for the Fuji film. 16
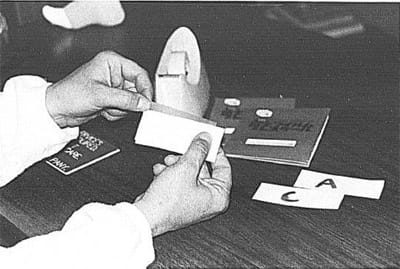
Figure 1. Separate pieces of Fuji A-film and C-fiIm.
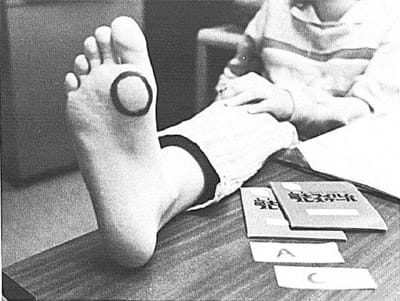
Figure 2. Circle on first metatarsal head.
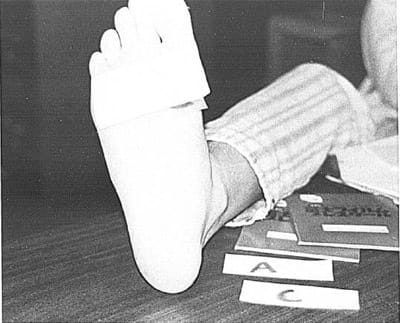
Figure 3. Rectangular film patch taped to subject’s foot.
The circle from the metatarsal head was transferred to the film and the darkest area within this circle was recorded. The pressure distribution is readily observable by the color density pattern formed on the C-film. For super low pressure Fuji Prescale Film there are six shades of red which can be related to pressure (Figure 4). For the low pressure film there are seven shades (Figure 5). The clinician selects which color sample on the chart matches the color on the film, a horizontal line is projected from the color sample selected to the curve, and then a line is projected vertically downward where the associated pressure is read. A 15% to 20% experimental error results from not knowing where on the color sample box to project horizontally to the curve. However, after a few film patches were compressed, it was observed that the shade of red on the film patch exposed did not match any of the color samples on the chart, i.e., the exposed film color was darker than one sample and lighter than the adjacent sample. Therefore, each color sample box on the chart was divided into an upper half and a lower half. The upper half of the box was selected if the exposed film was slightly darker than the color in the box and the lower half was selected if the exposed film was slightly lighter. The color samples on the super low and low pressure charts were divided in half and the corresponding pressures tabulated (Table 1). The width of each half box represents the range for each reading and was determined graphically by projecting horizontally from the top, middle, and bottom of each color sample box on the two pressure charts.

Figure 4. Super low pressure type pressure chart.

Figure 5. Low pressure type pressure chart.
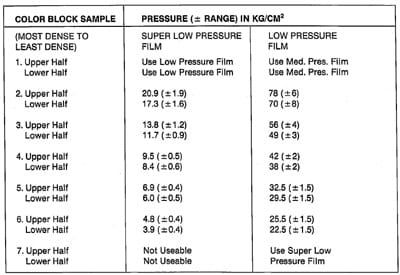
Table 1. Color Chart Interpretation.
Results
The results of evaluating the ten subjects with no orthosis, a cork/Spenco� shoe insert, and an unmolded Plastazote� insert are shown in Table 2. The mean pressures (� standard deviation) for the ten subjects were 34.2 (�2.4) kg/cm2, 15.9 (�1.2) kg/cm2, and 16.5 (� 1.2) kg/cm2 for no orthosis, cork/Spenco�, and Plastazote�, respectively. Generally, each of the shoe inserts resulted in less pressure on the metatarsal heads than was the case with no orthosis (p7/8.05) . However, the difference between pressures measured with custom molded cork/Spenco� insert versus the unmolded Plastazote� was not significant, 15.9( � 1.2) versus 16.5( � 1.2) kg/cm2. The percent reduction in pressure for each of the two inserts was computed and again the difference was not significant (Table 3): 53.2( �4.70) versus 51.1( �6.13) percent.
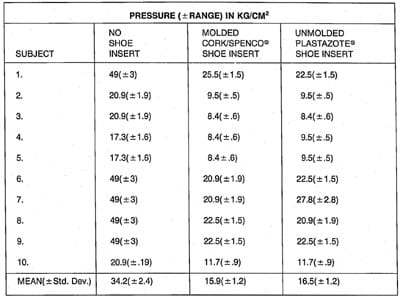
Table 2. Metatarsal Head Pressures – Color Chart Interpretation.
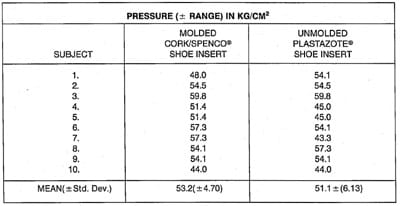
Table 3. Percent Reduction In Pressure.
Discussion
Previous clinical experience with custom molded cork/Spenco� and unmolded Plastazote � shoe inserts confirms the results obtained with the Fuji Prescale Film. That is, either of these inserts is better than no orthosis for relief of metatarsal head pressure. However, previous clinical experience supports the use of custom molded cork/ Spenco� versus unmolded Plastazote� inserts. This was not demonstrated by the Fuji Prescale Film and the color chart calibration method of determining pressure.
Perhaps the shades of red were too subtle to be differentiated visually on the color charts? Fuji (C. Itoh & CO.)16 has available an electronic densitometer which reportedly can resolve closer shades of red.
The color sample boxes along the ordinate of the calibration curves exceeded the usable limits of the curve. For example, on the super low and low pressure film chart, the most and least dense color boxes could not be used because horizontal projections with the curve did not exist.
The charts indicate that the pressure to be measured must be applied for at least two minutes. However, this was not considered practical and the subjects were asked to take 30 steps instead. The error associated with the variation is unknown. Early experimentation with small samples of the film indicated that the time integral related to pressure being applied for 30 steps was not perceptibly different from pressure being applied for two minutes or longer.
It is estimated that in a clinical setting, at least three film samples will be required per foot. One sample will be required with no orthosis to establish the need for the insert, one with the insert in the shoe to verify its efficacy, and one several months later as follow- up. The cost for the three film samples, at present levels, may preclude its usefulness. It is estimated that approximately 10 minutes is required by the practitioner at each plantar pressure sampling.
Small rectangular patches and color charts were used in this pilot study because the film and densitometer costs exceeded the limited funds available for the study. A full scale clinical study needs to be conducted using a Fuji densitometer and Fuji Prescale Film samples which match the entire insole area of the subjects’ shoes.
Authors
Gwen Ralphs is a graduate of the Orthotic and Prosthetic program at California State University Dominguez Hills and is now employed by Ortho Pro, Inc., of Nevada, as a board eligible practitioner.
at Rancho Los Amigos Medical Center, 7450 Leeds Street, Downey, California 90242, and Clinical Director of the Baccalaureate program in Orthotics and Prosthetics at California State University Dominguez Hills.
Jack Greenfield is Assistant Chief of the Orthotic Department at Rancho Los Amigos Medical Center, Downey, California.
References
- Boulton, A.J.M., C.A. Hardisty; R.P. Betts; c.l. Franks; J.D. Worth; and T. Duckworth, “Dynamic Foot Pressure and Other Studies as Diagnostic and Management Aids in Diabetic Neuropathy,” Diabetes Care, 6, 1983, pp. 26-33.
- Broadley, H.M., “Management of the Foot in Rheumatoid Arthritis,” Occ. Ther., 37-1,1974, pp.4-9.
- Patil, K.M., and H. Srinivasan, “Measurement of Pressure Under Leprotic Feet Using a Barograph,” J ollrnal of Rehabilitatioll Research alld Developmellt, 24-2, 1987, pp. 9-12.
- Hollingsworth,J.W., “Management of Rheumatoid Arthritis and Its Complications,” Year Book Medical Publishers Inc., 1978, Chicago, Illinois.
- Adams, J.C., “Arthritis and Back Pain,” University Park Press, 1973, Baltimore, Maryland.
- Hollander, J.L., “The Arthritis HandbookA Problem Oriented Approach to Arthritis Management,” Merk, Sharp, and Dohme, 1974, West Point, Pennsylvania.
- Beyerlein, H.R., “Die Messung des Druckverlaufs unter der Fussohle des MenschenMethoden und Etgebnisse” (Measurement of distribution of pressure under the human sole of the foot). Paper presented at the 1976 Symposium des Sonderforschungsbereichs 88, Munster, G.F.R., Aprill.
- Guth, V.; H. Theyson; and F. Abbink, “Application of Chronocyclographical and Electromyographical Methods of Analysis of Gait and Examination of Muscle Function with Physically Handicapped Children,” Paper presented at the 1976 Symposium des Sonderforschungsbereichs 88, Munster, G.F.R., Aprill.
- Stokes, l.A.F.; J.R.R Scott; and W. C. Hutton, “Force Distribution Under the Foot-A Dynamic Measuring System,” Biomed. Eng., 1974, p~. 140-143.
- Hennig, E.M., and K. Nicol, “Registration Methods for Time-dependent Pressure Distribution Measurement with Mats Working as Capacitors,” In: E. Asmussen and K. Jorgensen (eds.), Biomechanics 6-A, pp. 361-376, University Park Press, Baltimore, Maryland.
- Shipley, D.E., and K.M. Miner, “The Role of Physical Therapy in Foot Problems,” SlIrgical Rehabilitatioll ill Leprosy, The Williams & Wilkins Co., Baltimore, Maryland, 1974, pp. 301- 312.
- Silvino, N.; P.M. Evanski; and T.R. Waugh, “The Harris and Beath Footprinting Mat: Diagnostic Validity and Clinical Use,” Clinical Orth. ant/ Related Research, 151, September, 1980, pp. 265-269.
- Brand, P.W., and J.D. Ebner, “Pressure Sensitive Devices for Denervated Hands and Feet,” The JOl//’Ilal of BOlle and Joint SlIrgery, 51-2, 1969, pp. 109-116.
- of Recording Pressure Distribution Under the Sole of the Foot,” BlIlletin of Prosthetics Research, Fall, 1973, pp. 118-125.
- Bauman, J.H.” and P.W. Brand, “Plantar Pressures and Trophic Ulceration, An Evaluation of Footwear ,” The JOllrnal of Bone and Joint SlIrgery, 45B-4, 1963, pp. 652-673.
- Fuji Prescale Film, Instruction Manual, C. Itoh & Co. (America), Inc., 335 Madison Avenue, New York, NY 10017, (212) 818-8000.
- 17Aritomi, H.; M. Morita; and K. Yonemoto, “A Simple Method of Measuring the Footsole Pressure of Normal Subjects Using Prescale Pressure- Detecting Sheets,” J. Biomechanics, 16-2, 1983, pp. 157-165.


